 Arctic SDI catalogue
Surface water
Type of resources
Available actions
Topics
Keywords
Contact for the resource
Provided by
Years
Formats
Representation types
Update frequencies
status
Service types
Scale
-
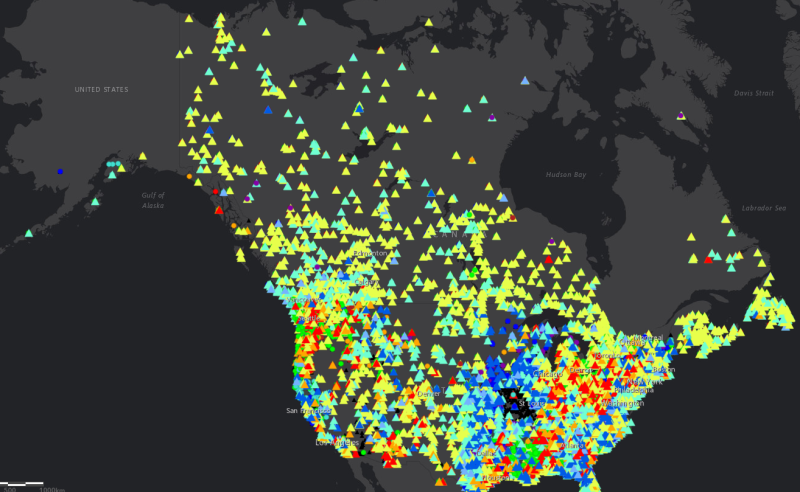
The North America Surface Water Values point dataset contains the current water level and stream flow values as recorded by Canadian and USA hydrometric gauging station locations. Daily values are recorded as well as comparisons with historical measurements, including difference in values from the previous day, the mean level for that calendar date, the annual mean water level, and maximum and minumum recorded levels. Percentile values based on historical average for both water level and stream flow are also included. Real-time gauging station data for Canada is available here: https://wateroffice.ec.gc.ca/search/statistics_e.html Real-time gauging station data for the United States is available here: https://waterservices.usgs.gov/rest/Statistics-Service.html
-
This product provides runoff data with each contour line corresponding to an average amount of annual runoff (in millimeters). Runoff data were derived from discharge values from hydrometric stations with natural flows. Not all years are included for every region of the country due to data quality and availability issues. Data cover the period 1971 to 2013 for the south and 1971 to 2004 for the north. These files were produced by Statistics Canada, Environment, Energy and Transportation Statistics Division, 2017, based on data from Environment and Climate Change Canada, 2015, Water Survey of Canada, Archived Hydrometric Data (HYDAT), www.ec.gc.ca/rhc- wsc/default.asp?lang=En&n=4EED50F1-1 (accessed December 3, 2015); Spence, C. and A. Burke, 2008, “Estimates of Canadian Arctic Archipelago runoff from observed hydrometric data,” Journal of Hydrology, Vol. 362, pp. 247–259. For more information about methods, results and limitations see Appendix D in Statistics Canada, 2017, “Freshwater in Canada,” Human Activity and the Environment, Catalogue no. 16-201-X. The purpose of the dataset is to present runoff values as derived from Statistics Canada's Water Yield Model on a national scale map of 1:32,000,000. This product is intended to be used for reference or mapping purposes. The product ends at the shoreline of Canada as defined by the drainage region boundaries supplied for Map 1.1 Drainage regions of Canada. It does not include the Arctic Islands. Users are responsible for verifying that the product is appropriate for their intended application.
-

This product provides the ratio of surface freshwater intake to water yield for August 2013, with the exception of drainage regions 7, 8, 16, 17 and 18, which use the ratio of August intake to the long-term minimum monthly water yield. Surface freshwater intake aggregates data from the Survey of Drinking Water Plants, 2013 and the Industrial Water Use Survey, 2013 with estimates of agricultural water use for 2013 based on the Agricultural Water Use Survey and the Alberta Irrigation Information report. Data for water use by the oil and gas industry and households not supplied by a public water provider are also excluded.
-

This product provides the variability index for selected drainage regions in Canada. Variability is measured using a coefficient of variation (CV) to compare all months over a 42-year time period and is a measure of the dispersion or variation in the monthly yield values from 1971 to 2013 (and 1971 to 2012 for drainage region 1). It is defined as the ratio of the standard deviation to the mean or the standard deviation divided by the mean, with higher CVs indicating more variability in monthly water yields. The monthly variability was not calculated for drainage regions 5, 7, 8, 16, 17, 18, or the Labrador portion of 25.
-

This product provides runoff data with each contour line corresponding to an average amount of annual runoff (in millimeters). Runoff data were derived from discharge values from hydrometric stations with natural flows. Not all years are included for every region of the country due to data quality and availability issues. Data cover the period 1971 to 2013 for the south and 1971 to 2004 for the north. These files were produced by Statistics Canada, Environment, Energy and Transportation Statistics Division, 2017, based on data from Environment and Climate Change Canada, 2015, Water Survey of Canada, Archived Hydrometric Data (HYDAT), www.ec.gc.ca/rhc- wsc/default.asp?lang=En&n=4EED50F1-1 (accessed December 3, 2015); Spence, C. and A. Burke, 2008, “Estimates of Canadian Arctic Archipelago runoff from observed hydrometric data,” Journal of Hydrology, Vol. 362, pp. 247–259. For more information about methods, results and limitations see Appendix D in Statistics Canada, 2017, “Freshwater in Canada,” Human Activity and the Environment, Catalogue no. 16-201-X. The purpose of the dataset is to present runoff values as derived from Statistics Canada's Water Yield Model on a national scale map of 1:32,000,000. This product is intended to be used for reference or mapping purposes. The product ends at the shoreline of Canada as defined by the drainage region boundaries supplied for drainage regions of Canada. It does not include the Arctic Islands.
-
This product provides runoff data with each contour line corresponding to an average amount of annual runoff (in millimeters). Runoff data were derived from discharge values from hydrometric stations with natural flows. Not all years are included for every region of the country due to data quality and availability issues. Data cover the period 1971 to 2013 for the south and 1971 to 2004 for the north. These files were produced by Statistics Canada, Environment, Energy and Transportation Statistics Division, 2017, based on data from Environment and Climate Change Canada, 2015, Water Survey of Canada, Archived Hydrometric Data (HYDAT), www.ec.gc.ca/rhc- wsc/default.asp?lang=En&n=4EED50F1-1 (accessed December 3, 2015); Spence, C. and A. Burke, 2008, “Estimates of Canadian Arctic Archipelago runoff from observed hydrometric data,” Journal of Hydrology, Vol. 362, pp. 247–259. For more information about methods, results and limitations see Appendix D in Statistics Canada, 2017, “Freshwater in Canada,” Human Activity and the Environment, Catalogue no. 16-201-X. The purpose of the dataset is to present runoff values as derived from Statistics Canada's Water Yield Model on a national scale map of 1:32,000,000. This product is intended to be used for reference or mapping purposes. The product ends at the shoreline of Canada as defined by the drainage region boundaries supplied for Map 1.1 Drainage regions of Canada. It does not include the Arctic Islands. Users are responsible for verifying that the product is appropriate for their intended application.
-

This product provides the boundaries for the 25 drainage regions in Canada and the five ocean drainage areas. These drainage regions cover all of the area within the coastal boundaries of Canada. These files were produced by Statistics Canada, Environment, Energy and Transportation Statistics Division, 2009, special tabulation of data from Pearse, P.H., F. Bertrand and J.W. MacLaren, 1985, Currents of Change: Final Report of the Inquiry on Federal Water Policy, Environment Canada, Ottawa.
-
This product provides the boundaries for the 25 drainage regions in Canada and the five ocean drainage areas. These drainage regions cover all of the area within the coastal boundaries of Canada. These files were produced by Statistics Canada, Environment, Energy and Transportation Statistics Division, 2009, special tabulation data from Pearse, P.H., F. Bertrand and J.W. MacLaren, 1985, Currents of Change: Final Report of the Inquiry on Federal Water Policy, Environment Canada, Ottawa.
-

The datasets contain water surface evaporation (PET, in mm of H2O) over Canada's landmass at a spatial resolution of 10-km and temporal intervals of a month and a year over a 24-year period of 2000-2023. The PET was produced by the Land Surface Model EALCO (Ecological Assimilation of Land and Climate Observations) developed at Natural Resources Canada. The PET algorithm in EALCO integrates the dynamic surface evolutions of liquid water, ice, and snow-on-ice for a waterbody into the Penman Equation. The PET was simulated at a daily time step. The monthly (or annual) PET in the datasets is the sum of the daily PET values in a month (or a year). Dew and frost formations simulated by EALCO are included in the PET as negative values, so the PET represents the net water flux between water surface and the atmosphere. Details of the dataset and the EALCO PET modelling algorithms can be found in Li, Wang, and Li (2020, Spatial variations and long‑term trends of potential evaporation in Canada. Scientific Reports, 10: 22089, doi.org/10.1038/s41598-020-78994-9).
-
A vector representation of stream networks is a crucial dataset for the modelling the surface water and groundwater components of the hydrologic cycle. For many usages a crucial attribute of the drainage network is a digital topology and hierarchal stream order attribute (e.g., Strahler stream order). In Canada jurisdictional stream networks are available for the provinces and territories and nationally for Canada in the National Hydrological Network (NHN) dataset. Unfortunately, the NHN data lacks the same topological and attribute information that is available for numerous provinces due to standardization for the entire country. For Canada1Water it was also necessary to have a harmonized dataset with the United States, for both the southern transboundary watersheds and the Alaskan watersheds. This report documents the processes completed to upgrade the topological and graph network support for NHN and provide continuous connectivity with US datasets. It also highlights and corrects a number of stream density and stream order issues that occur within Canada across provincial and territorial borders and NTS tiles. All vector processing was completed in RivEX software extension for ArcMap. Following complete topological correction stream classification was assigned and a table of the node graph network developed. Additional work was then completed to normalize stream density particularly amongst low-order streams between British Columbia and the Yukon and amongst local NTS tiles in Quebec and Ontario. Corrected NHN Strahler stream order assignment was validated against a number of provincial and watershed datasets, all of which already have Strahler stream order attributed. These datasets are the same underlying digitized vector data, so there are no differences in node or polyline positions. Strahler stream order assignment validation was only done by visual comparison as due to differences in vector segments a statistical comparison is complicated. The transboundary integrated C1W stream network with complete classification provides a seamless national dataset to support transdisciplinary studies (fisheries, wildlife, health, pesticide and nutrient issues, mining impact, ecosystem restoration, numeric modelling) that involve a knowledge of stream distribution and ranking.