 Arctic SDI catalogue
Government of Canada; Fisheries and Oceans Canada
Type of resources
Available actions
Topics
Keywords
Contact for the resource
Provided by
Years
Formats
Representation types
Update frequencies
status
Service types
-

Fish Habitat Assessment Output: 5 of 16 High Water Level (75.4m ASL) - Juvenile/Adult Habitat - High Vegetation Association Species (All Thermal Guilds) Habitat suitability was assessed for the Bay of Quinte Area of Concern, at a 3 m grid resolution, using the Habitat Ecosystem Assessment Tool (HEAT), temperature algorithms, vegetation models, and water level input. Habitat classifications were based on three variables: depth (elevation), vegetation, and substrate; and modified by temperature suitabilities. The final suitability maps were based on documented habitat and temperature associations for the fish in the area. Different life stages (spawning requirements, nursery habitat, adult habitat) were modeled for the years of 1972-2011. Suitability values were scaled from 0 (not suitable) to 1 (highly suitable) and converted to suitability classes of very low, low, medium, and high. The final maps for each guild – life stage combination are maximum suitability values from the 39-year period modelled.
-
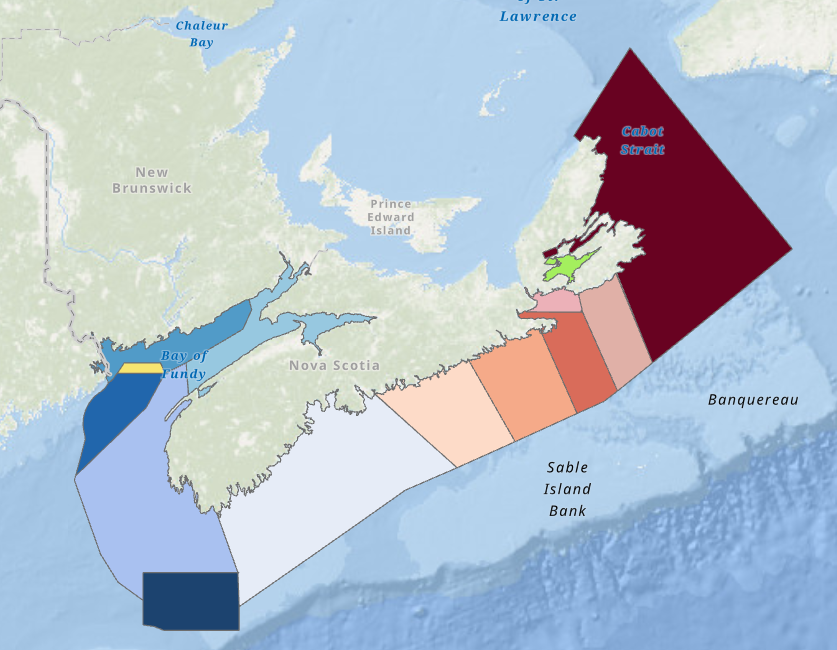
This report outlines the results of a project that created a series of maps tracking inshore historical Lobster fishing district boundaries from 1899 to present. This work has been part of Fisheries and Oceans Canada’s (DFO) Blue Economy Lobster Team (BELT) pilot project on the Lobster fishery. To provide the context for the use of historical information within fisheries research, this report provides a brief summation of the discipline of history, its purpose, and its methods. It also describes the different ways that historical data has been used to support the analysis of fisheries, and some of the ways that historians have integrated the techniques of natural and social sciences into their own work. It provides an overview of how the BELT has incorporated historical methods and methodologies into the team’s overall work. The report presents two sets of maps that outline geographical changes in Lobster fishing districts (called Lobster Fishing Areas after 1985) as well as changes in minimum legal size (MLS) and season length information. These maps help to inform a larger understanding of the historical Lobster fishery in the present-day Maritimes Region, and highlight several themes within the fishery. This includes the increasingly intensive regulation of the fishery over time, the inshore nature of the Lobster fishery for the majority of the twentieth century, the variability in the boundaries of Lobster districts over time, and the broad transition from a cannery-based market to a live Lobster market. The maps taken as a whole help to demonstrate consistency of the regulatory approach to Lobster over the twentieth century. However, there are limitations to the interpretive capacity of these maps, as more work should be done to investigate the specific reasoning behind why each change occurred. **Note: The outer boundaries depicted from 1899-1974 are not meant to represent areas where DFO or its predecessor departments had complete or authoritative control of the inshore fishery. In past regulations, districts were described as “on and along the coast.” The outer boundaries assigned to maps prior to 1985 were chosen to make the maps easy to understand relative to current lobster fishing areas.
-
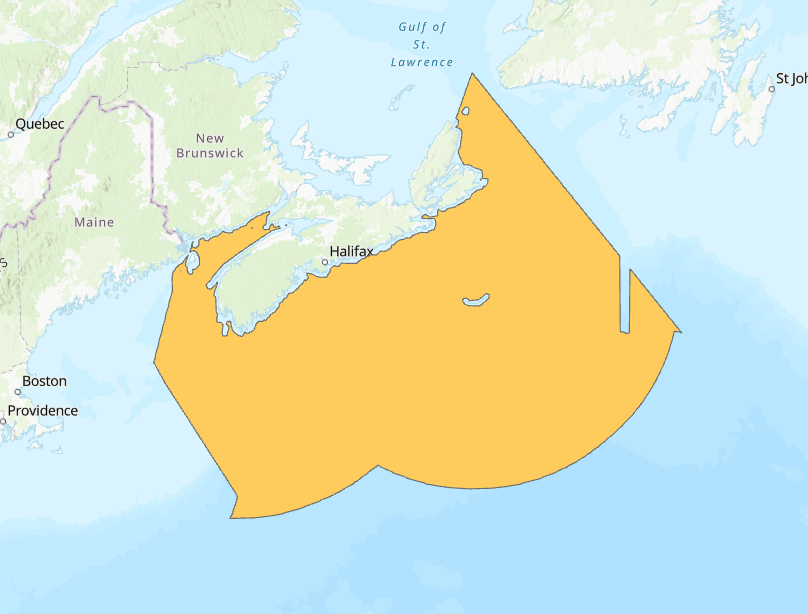
Species distribution models (SDMs) are tools that combine species observations of occurrence, abundance, or biomass with environmental variables to predict the distribution of a species in unsampled locations. To produce accurate predictions of occurrence, abundance or biomass distribution, a wide range of physical and/or biological variables is desirable. Such data is often collected over limited or irregular spatial scales, and require the application of geospatial techniques to produce continuous environmental surfaces that can be used for modelling at all spatial scales. Here we provide a review of 102 environmental data layers that were compiled for the entire spatial extent of Fisheries and Oceans Canada’s (DFO) Maritimes Region. Variables were obtained from a broad range of physical and biological data sources and spatially interpolated using geostatistical methods. For each variable we document the underlying data distribution, provide relevant diagnostics of the interpolation models and an assessment of model performance, and present the final standard error and interpolation surfaces. These layers have been archived in a common (raster) format at the Bedford Institute of Oceanography to facilitate future use. Based on the diagnostic summaries in this report, a subset of these variables has subsequently been used in species distribution models to predict the distribution of deep-water corals, sponges, and other significant benthic taxa in the Maritimes Region. Cite this data as: Beazley, Lindsay; Guijarro, Javier, Lirette; Camille; Wang, Zeliang; Kenchington, Ellen (2020). Characteristics of Environmental Data Layers for Use in Species Distribution Modelling in the Maritimes Region. Published July 2023. Ocean Ecosystems Science Division, Fisheries and Oceans Canada, Dartmouth, N.S. https://open.canada.ca/data/en/dataset/34a917cb-a0e3-403c-91c7-af3dc20628b1
-

Fish Habitat Assessment Output: 15 of 16 Average Water Level (75.0m ASL) - Juvenile/Adult Habitat - Low Vegetation Association Species (Coolwater Guild) Habitat suitability was assessed for the Bay of Quinte Area of Concern, at a 3 m grid resolution, using the Habitat Ecosystem Assessment Tool (HEAT), temperature algorithms, vegetation models, and water level input. Habitat classifications were based on three variables: depth (elevation), vegetation, and substrate; and modified by temperature suitabilities. The final suitability maps were based on documented habitat and temperature associations for the fish in the area. Different life stages (spawning requirements, nursery habitat, adult habitat) were modeled for the years of 1972-2011. Suitability values were scaled from 0 (not suitable) to 1 (highly suitable) and converted to suitability classes of very low, low, medium, and high. The final maps for each guild – life stage combination are maximum suitability values from the 39-year period modelled.
-

The blue shark (Prionace glauca), is a species found in Atlantic Canadian waters which is commonly encountered in commercial and recreational fisheries. Pop-up Satellite Archival Tags (PSAT) and Smart Position and Temperature tag (SPOT) from Wildlife Computers were applied to blue sharks from 2004 to 2008 to collect data on depth (pressure), temperature and ambient light level (for position estimation). Deployments were conducted in Canada on commercial and recreational vessels from mid-August to early October, but mostly in September. A variety of tag models were deployed: PAT 4 (n=16), Mk10 (N=28), and SPOT3 (N=2) and 39 of 46 tags reported. The blue sharks tagged ranged in size from 124 cm to 251 cm Fork Length (curved); 30 were female, 15 were male and 1 was unknown sex. Time at liberty ranged from 4 – 210 days and 16 tags remained on for the programmed duration. Raw data transmitted from the PSAT’s after release was processed through Wildlife Computers software (GPE3) to get summary files, assuming a maximum swimming speed of 2m/s, NOAA OI SST V2 High Resolution data set for SST reference and ETOPO1-Bedrock dataset for bathymetry reference. The maximum likelihood position estimates are available in .csv and .kmz format and depth and temperature profiles are also in .csv format. Other tag outputs as well as metadata from the deployments can be obtained upon request from: warren.joyce@dfo-mpo.gc.ca or heather.bowlby@dfo-mpo.gc.ca.
-
PURPOSE: "Biological, relative abundance, and environmental data have been collected from the Yellowknife River Cisco population that can be used to inform fisheries management decision-making. Under the conditions of a commercial licence issued under the New Emerging Fisheries Policy, licence holders are required to record catch and biological information to support the assessment of the feasibility and sustainability of the fishery over time, and potential advancement in the stages of a developing fishery. In addition to the information collected from the commercial harvest (fishery-dependent), a fishery-independent sampling and snorkel survey program was conducted with the objective of collecting additional biological, observational, and environmental data during the fall spawning run. The objective of this report is to compile available data from fishery-dependent and fishery-independent sampling of adfluvial Yellowknife River Cisco during fall, 1998-2020*, specifically by: • Summarizing commercial fishery quotas and reported harvest; • Characterizing population demographics and examining for trends over time; • Summarizing metrics of relative abundance (i.e., catch-per-unit-effort data and snorkel survey observations) and examining for trends over time; and • Determining if there were any associations between relative abundance of Cisco and river discharge and temperature. *A commercial harvest occurred in 1998, although no biological or catch-effort records were located. In addition, in response to concerns about the status of the population, the fishery was put on hold 2006–2009 to allow for a population assessment (no data during that time). DESCRIPTION: Cisco (Coregonus artedi) from the Yellowknife River, Northwest Territories, are an important fishery resource for nearby communities. Biological, catch-effort, and environmental data were collected from the Yellowknife River (Tartan Rapids and Bluefish areas) during their fall spawning run from Great Slave Lake. Data from the commercial harvest (fishery-dependent; 1998–2020) and supplementary monitoring (fishery-independent; 2013–2020) of these adfluvial Cisco were compiled to summarize commercial fishery quotas and reported harvest, characterize population demographics and catch-effort over time, and assess potential associations between relative abundance and seasonal river characteristics. A single commercial fishing licence for Cisco was issued on an annual basis each fall for 1,000 kg from 1998–2002, 2,000 kg from 2004–2005, 1,000 kg from 2010–2018, and 1,500 kg from 2019–2020. Cisco ranged from 102–239 mm fork length, 10.0–139.6 g round weight, and 1 and 9 years of age, with the majority of fish (>99%) being sexually mature. The demographics (length, weight, age) of the spawning population collected from the commercial fishery remained relatively stable between 1999 and 2020. Catch-effort of the commercial fishery varied widely among years without trend, although this was not standardized to the number of individuals/nets used to capture the fish. The biological, catch-effort, and environmental data collected from the Yellowknife River spawning population of Cisco serve as a benchmark for their ongoing assessment and management.
-

Biological samples of Geoduck Clams have been collected during surveys in British Columbia as part of the broader survey objectives of determining Geoduck density, distribution and population structure. Samples of Geoducks were collected from 41 locations throughout British Columbia between 1993 and 2002. Clams were measured for total weight, shell length, shell weight and were aged. Biological parameters are presented here for individual clams sampled. See Bureau D., W. Hajas, N.W. Surry, C.M. Hand, G. Dovey and A. Campbell. 2002. Age, size structure and growth parameters of Geoducks (Panopea abrupta, Conrad 1849) from 34 locations in British Columbia sampled between 1993 and 2000. Can Tech. Rep. Fish. Aquat. Sci. 2413: 84 p. and Bureau D., W. Hajas, C.M. Hand and G. Dovey. 2003. Age, size structure and growth parameters of Geoducks (Panopea abrupta, Conrad 1849) from seven locations in British Columbia sampled in 2001 and 2002. Can. Tech. Rep. Fish. Aquat. Sci. 2494: 29 p.
-

The data in this layer represents habitat suitability of soft-shelled clams (Mya arenaria) in the DFO Maritimes region, and was developed using an interdepartmental approach. Substrate classification data as well as bathymetric data for the Region were used to identify potential habitat for soft-shelled clams. Substrates identified as suitable included: sand, mud, sand and mud (Greenlaw, 2022). Contours (0m and 70m) from GEBCO bathymetric data were used to isolate depths between which soft-shelled clams are present. At this stage, a polygon reflecting soft substrates from 0-70m was created as "Suitable". A "Not Suitable" layer was similarly created using the substrates: boulders, continuous bedrock, discontinuous bedrock, gravel, mixed sediment, sand and gravel. To digitally validate the model, the Regional shoreline was divided into subsectors (developed by Environment and Climate Change Canada for the Canadian Shellfish Sanitation Program). Data from DFO (clam harvesting intensity) as well as Conservation and Protection (clam harvesting infraction locations) were used to established species presence within each sub-sector. If there had been any harvesting activity, legal or illegal, in an individual subsector, it was considered "Suitable and Validated". Merged into one final product, the model includes areas that are "Not Suitable", "Suitable", as well as "Suitable and Validated" for soft-shelled clam habitat. Cite this data as: Harvey, C., Vincent, M., Greyson, P., Hamer, A. (2024) Data of: A Soft-Shelled Clam (Mya arenaria) Habitat Suitability Model For The DFO Maritimes Region. Published: January 2024. Coastal Ecosystems Science Division, Fisheries and Oceans Canada, St. Andrews, N.B. https://open.canada.ca/data/en/dataset/c76f7813-d802-4b31-8ebe-476f8a7cacf2
-

Plankton (zooplankton and large phytoplankton) are collected using the Continuous Plankton Recorder (CPR) in the Northwest (NW) Atlantic along tracks transited by container ships from Reykjavik (Iceland) to St. John’s, NL (the Z line), and between St. John’s and the New England Coast, along the Scotian Shelf (the E and MD lines). The CPR Survey is the longest running, most geographically extensive marine ecological survey in the world, providing comparable data on the geographical distribution, seasonal cycles and year-to-year changes in abundance of plankton over a large spatial area. The first northwest Atlantic samples were collected in the Irminger Sea in 1957, and sampling was extended farther west to the Scotian Shelf a few years later. Sampling has continued to the present with some interruptions during the late 1970s and 1980s. Sampling is nominally once per month along the E, MD, and Z lines. DFO Sample collection and analysis are led by the Continuous Plankton Recorder Survey program at the Marine Biological Association of the UK. DFO provides partial support for the northwest Atlantic survey carried out on the E, MD, and Z lines and incorporates CPR data in Atlantic Zone Monitoring Program ocean environmental status reporting.
-

PURPOSE: The research survey provides a fisheries-independent source of information about all marine living organisms that are captured by the fishing trawl used to obtain samples in the southern Gulf of St. Lawrence. DESCRIPTION: Tow, catch, length frequency, and biological information for fish caught during the annual September research vessel trawl surveys in the southern Gulf of St. Lawrence (NAFO Division 4T). Abundance indices and spatial distribution patterns of commercial and non-commercial groundfish. The catch data that appear in this dataset SHOULD NOT BE USED FOR ECOLOGICAL ANALYSES INVOLVING CATCH RATES. Important factors such as vessel, fishing gear and diurnal periods must be accounted for to use these data in analyses. Please contact the data custodians if you are interested in using this data for any kind of ecological analyses involving catch rates. PARAMETERS COLLECTED: abundance estimates (ecological); distribution (ecological); species counts (ecological); gear (fishing); vessel information (fishing); point (spatial) NOTES ON QUALITY CONTROL: Scientific names listed in the survey species list have been mapped to recognized standards - marine taxa have been mapped to the World Register of Marine Species (WoRMS) using their online taxon match tool. All sampling locations were plotted on a map to perform a visual check confirming that the latitude and longitude coordinates were within the described sampling area. In 2003, because of a fire aboard the Alfred Needler, the Wilfred Templeman was used for the survey. However, no comparative fishing experiments have been conducted between the Alfred Needler and the Wilfred Templeman. We are therefore unable to integrate the indices derived for 2003 to the remainder of the survey time-series. SAMPLING METHODS: Sampling Method: Consult the "Protocols for research vessel cruises within the Gulf Region (dermersal fish) (1970-1980)" report, link provided in the citations list. USE LIMITATION: To ensure scientific integrity and appropriate use of the data, we would encourage you to contact the data custodian.