 Arctic SDI catalogue
Surface water
Type of resources
Available actions
Topics
Keywords
Contact for the resource
Provided by
Years
Formats
Representation types
Update frequencies
status
Service types
Scale
-
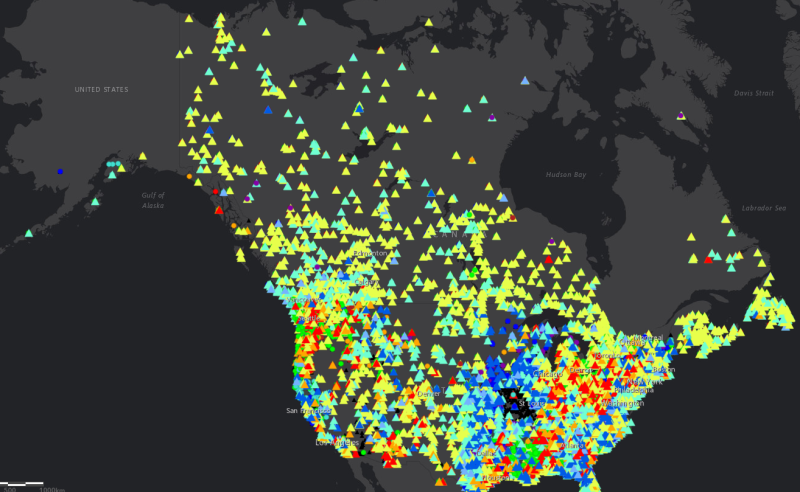
The North America Surface Water Values point dataset contains the current water level and stream flow values as recorded by Canadian and USA hydrometric gauging station locations. Daily values are recorded as well as comparisons with historical measurements, including difference in values from the previous day, the mean level for that calendar date, the annual mean water level, and maximum and minumum recorded levels. Percentile values based on historical average for both water level and stream flow are also included. Real-time gauging station data for Canada is available here: https://wateroffice.ec.gc.ca/search/statistics_e.html Real-time gauging station data for the United States is available here: https://waterservices.usgs.gov/rest/Statistics-Service.html
-
This product provides runoff data with each contour line corresponding to an average amount of annual runoff (in millimeters). Runoff data were derived from discharge values from hydrometric stations with natural flows. Not all years are included for every region of the country due to data quality and availability issues. Data cover the period 1971 to 2013 for the south and 1971 to 2004 for the north. These files were produced by Statistics Canada, Environment, Energy and Transportation Statistics Division, 2017, based on data from Environment and Climate Change Canada, 2015, Water Survey of Canada, Archived Hydrometric Data (HYDAT), www.ec.gc.ca/rhc- wsc/default.asp?lang=En&n=4EED50F1-1 (accessed December 3, 2015); Spence, C. and A. Burke, 2008, “Estimates of Canadian Arctic Archipelago runoff from observed hydrometric data,” Journal of Hydrology, Vol. 362, pp. 247–259. For more information about methods, results and limitations see Appendix D in Statistics Canada, 2017, “Freshwater in Canada,” Human Activity and the Environment, Catalogue no. 16-201-X. The purpose of the dataset is to present runoff values as derived from Statistics Canada's Water Yield Model on a national scale map of 1:32,000,000. This product is intended to be used for reference or mapping purposes. The product ends at the shoreline of Canada as defined by the drainage region boundaries supplied for Map 1.1 Drainage regions of Canada. It does not include the Arctic Islands. Users are responsible for verifying that the product is appropriate for their intended application.
-

This product provides the ratio of surface freshwater intake to water yield for August 2013, with the exception of drainage regions 7, 8, 16, 17 and 18, which use the ratio of August intake to the long-term minimum monthly water yield. Surface freshwater intake aggregates data from the Survey of Drinking Water Plants, 2013 and the Industrial Water Use Survey, 2013 with estimates of agricultural water use for 2013 based on the Agricultural Water Use Survey and the Alberta Irrigation Information report. Data for water use by the oil and gas industry and households not supplied by a public water provider are also excluded.
-

This product provides the variability index for selected drainage regions in Canada. Variability is measured using a coefficient of variation (CV) to compare all months over a 42-year time period and is a measure of the dispersion or variation in the monthly yield values from 1971 to 2013 (and 1971 to 2012 for drainage region 1). It is defined as the ratio of the standard deviation to the mean or the standard deviation divided by the mean, with higher CVs indicating more variability in monthly water yields. The monthly variability was not calculated for drainage regions 5, 7, 8, 16, 17, 18, or the Labrador portion of 25.
-
This product provides runoff data with each contour line corresponding to an average amount of annual runoff (in millimeters). Runoff data were derived from discharge values from hydrometric stations with natural flows. Not all years are included for every region of the country due to data quality and availability issues. Data cover the period 1971 to 2013 for the south and 1971 to 2004 for the north. These files were produced by Statistics Canada, Environment, Energy and Transportation Statistics Division, 2017, based on data from Environment and Climate Change Canada, 2015, Water Survey of Canada, Archived Hydrometric Data (HYDAT), www.ec.gc.ca/rhc- wsc/default.asp?lang=En&n=4EED50F1-1 (accessed December 3, 2015); Spence, C. and A. Burke, 2008, “Estimates of Canadian Arctic Archipelago runoff from observed hydrometric data,” Journal of Hydrology, Vol. 362, pp. 247–259. For more information about methods, results and limitations see Appendix D in Statistics Canada, 2017, “Freshwater in Canada,” Human Activity and the Environment, Catalogue no. 16-201-X. The purpose of the dataset is to present runoff values as derived from Statistics Canada's Water Yield Model on a national scale map of 1:32,000,000. This product is intended to be used for reference or mapping purposes. The product ends at the shoreline of Canada as defined by the drainage region boundaries supplied for Map 1.1 Drainage regions of Canada. It does not include the Arctic Islands. Users are responsible for verifying that the product is appropriate for their intended application.
-

This product provides the boundaries for the 25 drainage regions in Canada and the five ocean drainage areas. These drainage regions cover all of the area within the coastal boundaries of Canada. These files were produced by Statistics Canada, Environment, Energy and Transportation Statistics Division, 2009, special tabulation of data from Pearse, P.H., F. Bertrand and J.W. MacLaren, 1985, Currents of Change: Final Report of the Inquiry on Federal Water Policy, Environment Canada, Ottawa.
-

This product provides runoff data with each contour line corresponding to an average amount of annual runoff (in millimeters). Runoff data were derived from discharge values from hydrometric stations with natural flows. Not all years are included for every region of the country due to data quality and availability issues. Data cover the period 1971 to 2013 for the south and 1971 to 2004 for the north. These files were produced by Statistics Canada, Environment, Energy and Transportation Statistics Division, 2017, based on data from Environment and Climate Change Canada, 2015, Water Survey of Canada, Archived Hydrometric Data (HYDAT), www.ec.gc.ca/rhc- wsc/default.asp?lang=En&n=4EED50F1-1 (accessed December 3, 2015); Spence, C. and A. Burke, 2008, “Estimates of Canadian Arctic Archipelago runoff from observed hydrometric data,” Journal of Hydrology, Vol. 362, pp. 247–259. For more information about methods, results and limitations see Appendix D in Statistics Canada, 2017, “Freshwater in Canada,” Human Activity and the Environment, Catalogue no. 16-201-X. The purpose of the dataset is to present runoff values as derived from Statistics Canada's Water Yield Model on a national scale map of 1:32,000,000. This product is intended to be used for reference or mapping purposes. The product ends at the shoreline of Canada as defined by the drainage region boundaries supplied for drainage regions of Canada. It does not include the Arctic Islands.
-
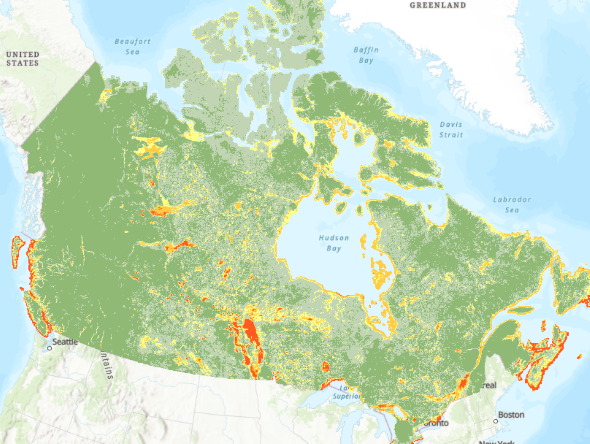
This national map of flood susceptibility or flood prone areas is based on patterns of historic flood events as predicted by an ensemble machine learning model. The recommended use is national, provincial or regional scale and can be used as a guide for identifying areas for further investigation. The Flood Susceptibility Index (FSI) Dataset, while processed and available at 30m cell size, is not recommended for use at the pixel or street level, given the uncertainty in the modelling process and the variability of results as discussed in https://www.mdpi.com/2673-4931/25/1/18 . For additional details on the methods, tests, models and datasets used to generate this data layer, please see https://geoscan.nrcan.gc.ca/starweb/geoscan/servlet.starweb?path=geoscan/fulle.web&search1=R=329493
-

This theme represents an indicator of the availability of summer and winter surface water. It combines a sub-indicator of the pressure of water samples from surface water, and a sub-indicator of the severity of low water levels. The indicator is calculated based on the current and future climate.**This third party metadata element was translated using an automated translation tool (Amazon Translate).**
-

This product provides the median of monthly maximum turbidity values (in nephelometric turbidity units) for drinking water facilities by drainage region. Turbidity refers to the relative cloudiness of water, caused by suspended particles in water. The Survey of Drinking Water Plants collected this monthly maximum turbidity data for surface water sources from facilities reporting turbidity data for at least 10 months in 2013. These facilities served 24 million people and produced 4,091 million cubic metres of potable water from surface water sources in 2013. Source water turbidity was monitored continuously at 42% of these drinking water plants in 2013, daily at 34% of plants and less frequently at the remaining plants.