 Arctic SDI catalogue
European Environment Agency
Type of resources
Available actions
Topics
Keywords
Contact for the resource
Provided by
Years
Formats
Service types
Scale
Resolution
-

This metadata covers the Ice Cover Duration (ICD) product is generated once a year and it provides an estimated number of ice covered days for each pixel in the inland waters at European scale. The product is derived from Water/Ice Cover (WIC) products, both from Sentinel-1 and Sentinel-2 observations. It has a spatial resolution of 20 m x 20 m. It is also available in another projection as tiles aligned with the Pan-European High-Resolution Layers in the European 20 m x 20 m grid (ETRS89 LAEA - EPSG: 3035). ICD is one of the products of the pan-European High-Resolution Water Snow & Ice portfolio (HR-WSI), which are provided at high spatial resolution from the Sentinel-2 and Sentinel-1 constellations data from September 1, 2016 onwards.
-
This is the metadata covering the Water Layer (WL) product. The WL is one of the products of the pan-European High-Resolution Water Snow & Ice portfolio (HR-WSI), which are provided at high spatial resolution from the Sentinel-2 and Sentinel-1 constellations data from September 1, 2016 onwards.. The WL is generated for the 2021 & 2024 reference year. It is a a multi-annual product based on the information covering the period (e.g. 2016-2021). In the context of the HR-WSI, the water and dry frequency masks are derived from intermediate outputs of the WCD workflow, the monthly surface water masks in combination with the WIC S2 NRT product. It provides detailed information about the presence and condition of water surfaces across Europe. There are 5 major classes like: - Dry (always or mostly dry with minor instances of wet) - permanent water (always contains water) - temporary water ( temporary water surfaces, aliteration of dry and water) - sea water (oceans and sea) - clouds It is also generated in different spatial resolutions (10m and 100m) and projections (LAEA & WGS84/UTM). The High Resolution Water Layer portfolio consists of the WL, the Water Presence Index (WPI), the Water confidence layer (WCL) and the Rolling archive (WLRA). The WL is provided in a package (zip) containing the WL, the WPI and the WCL: The WCL is displaying a measure of confidence between 0 and 100%. It identifies the likelihood of (in)correctness on pixel level based on information gained during production for the WL for the respective reference year. It is also generated in different spatial resolutions (10m and 100m) and projections (LAEA & WGS84/UTM). The Water Presence Index (WPI) product is one of the products of the pan-European High-Resolution Water Snow & Ice portfolio (HR-WSI), which are provided at high spatial resolution from the Sentinel-2 and Sentinel-1 constellations data from September 1, 2016 onwards. The High Resolution Water Layer portfolio consists of the Water Layer (WL), the Water Presence Index (WPI), the Water confidence layer (WCL) and the Rolling archive (WLRA). The WPI is generated for the 2021 reference year. It is a a multi-annual product based on the information covering a7-year period (e.g. 2016-2021). In the context of the HR-WSI, the water and dry frequency masks are derived from intermediate outputs of the WCD workflow, the monthly surface water masks in combination with the WIC S2 NRT product. It provides detailed information about the presence and condition of water surfaces across Europe. It is also generated in different spatial resolutions (10m and 100m) and projections (LAEA & WGS84/UTM).
-
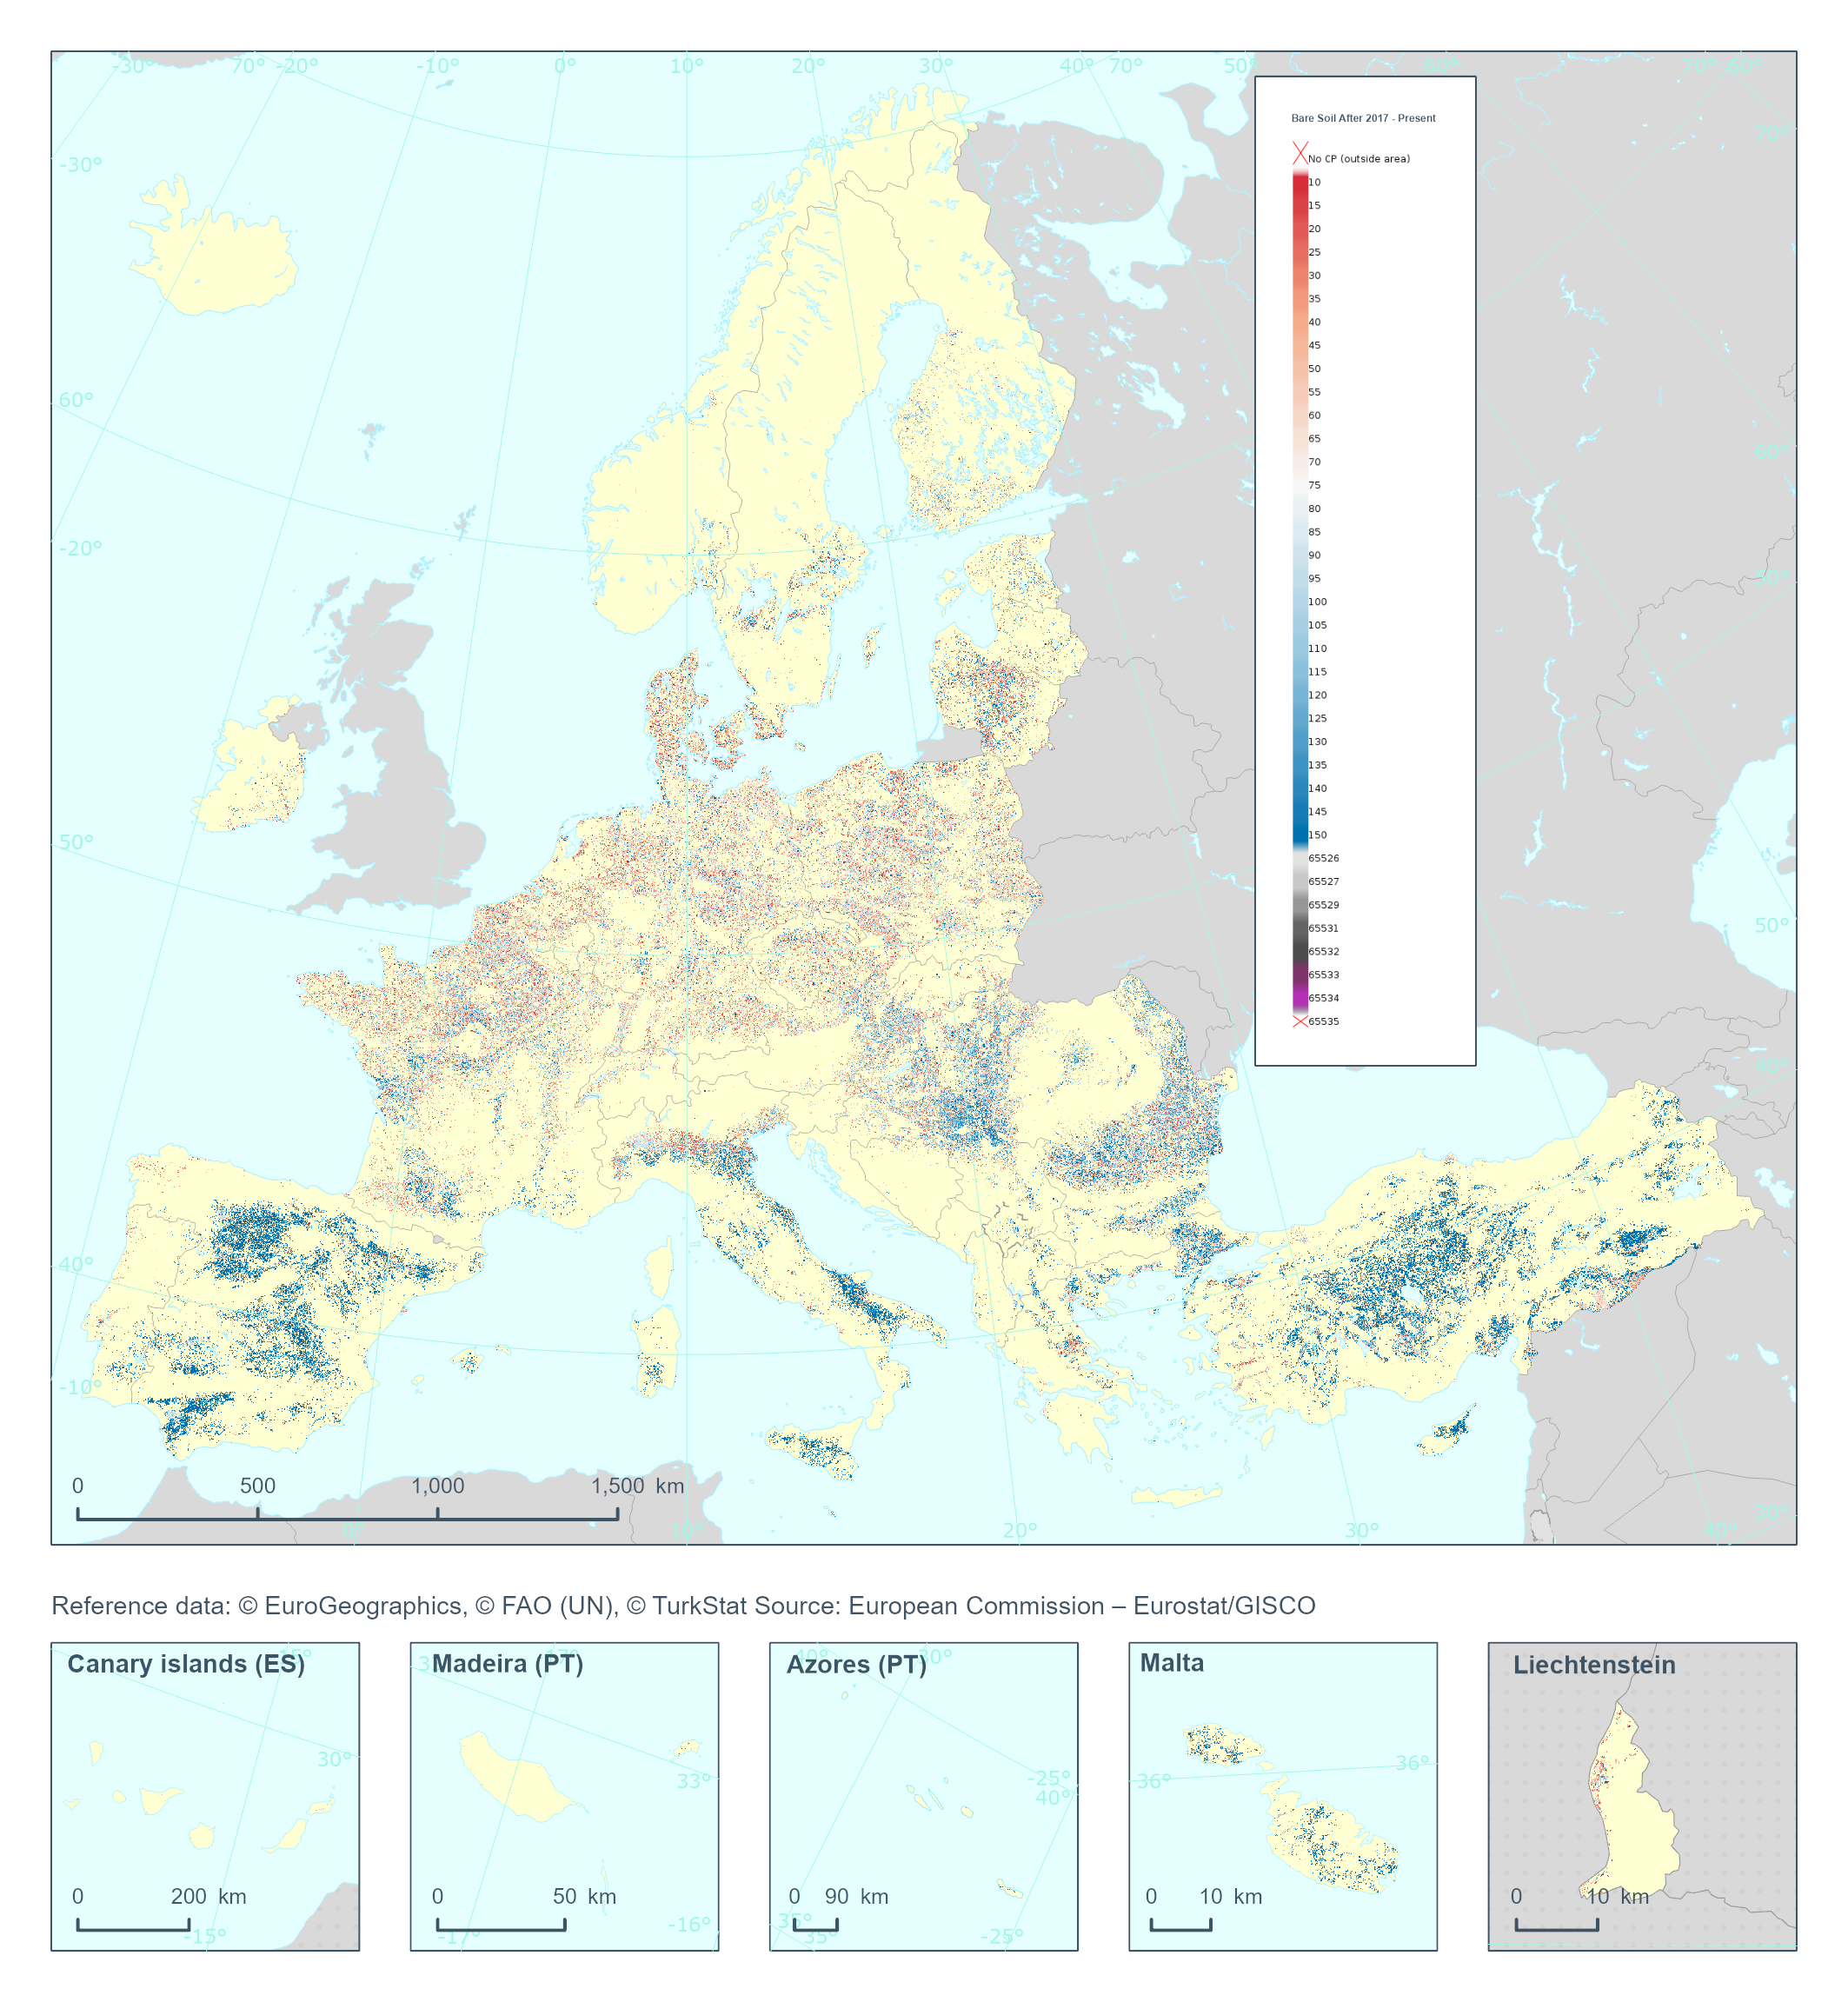
The High Resolution Layer Cropping Patterns - Bare Soil After (CPBSA) raster product provides bare soil period (in days) after the harvest of the main annual crop. Note that the bare soil period cannot transcend the calendar year for which the product is generated. This dataset is provided annually starting in 2017 with 10 meter rasters (fully conformant with the EEA reference grid) in 100 x 100 km tiles covering the EEA38 countries. High Resolution Layer Croplands product is part of the European Union’s Copernicus Land Monitoring Service. Confidence layer available for the dataset. This dataset includes data from the French Overseas Territories (DOMs)
-
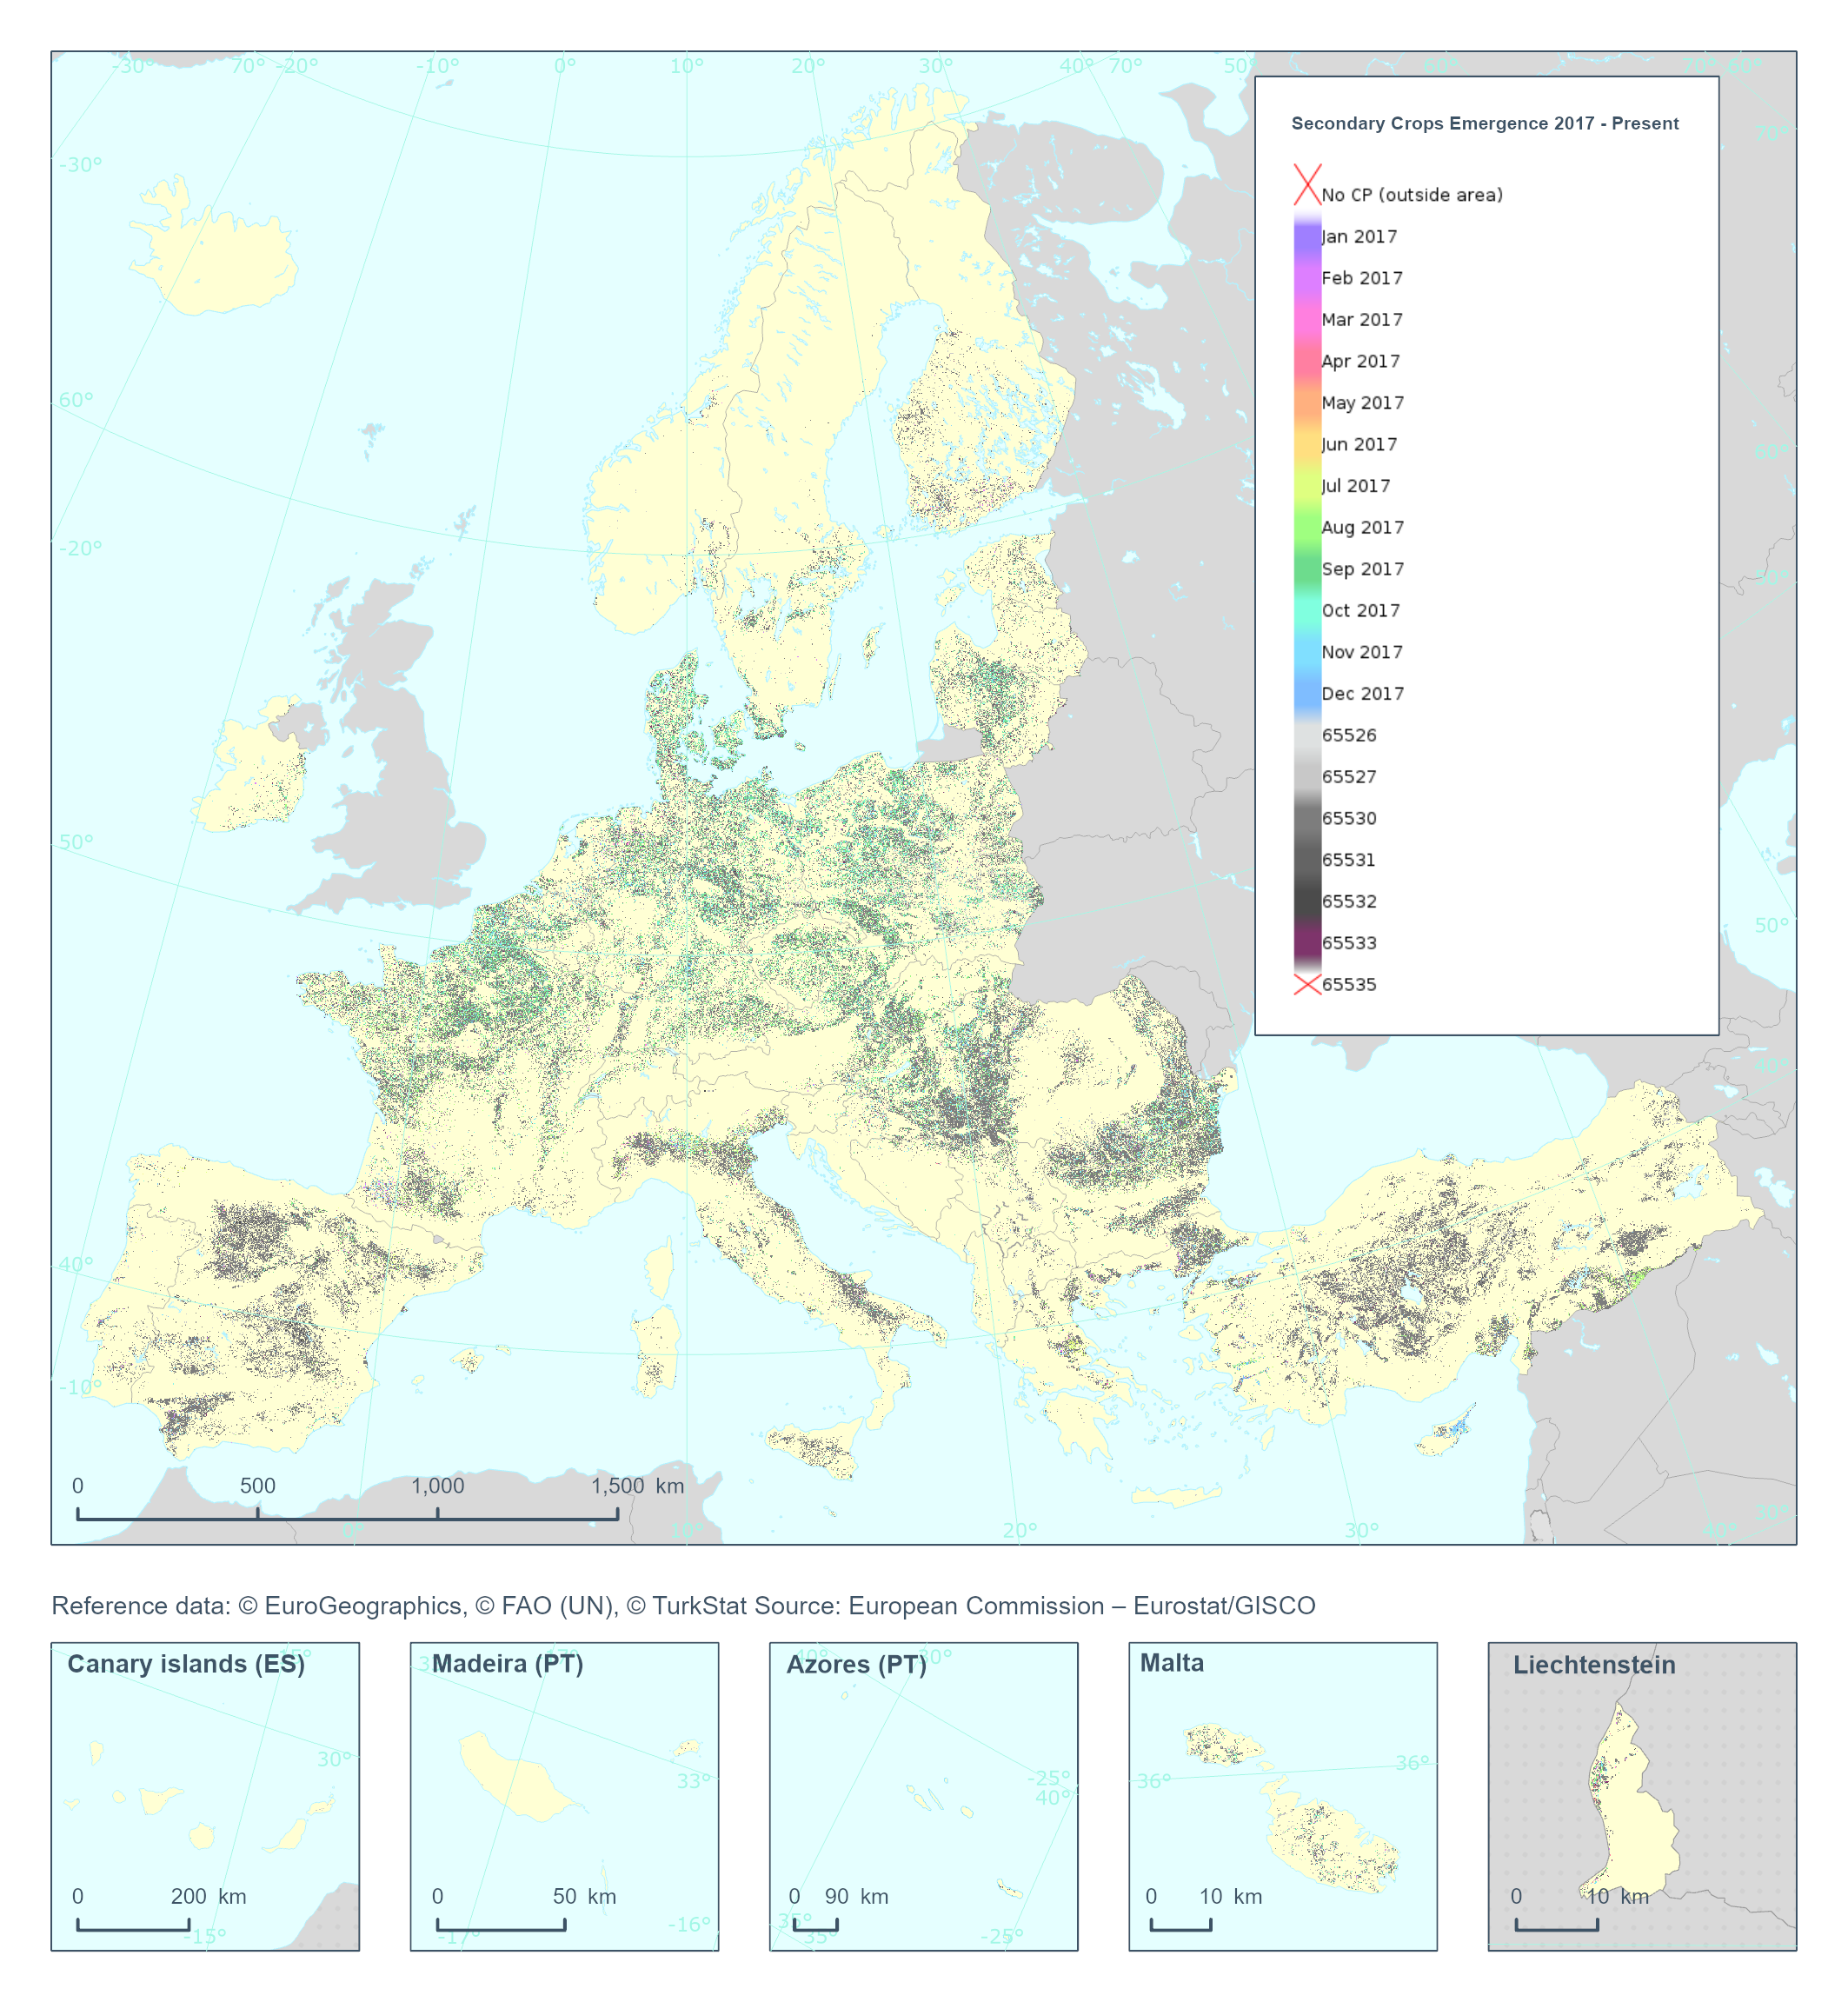
The High Resolution Layer Cropping Patterns - Secondary Crop Emergence (CPSCE) raster product provides the date of emergence of the cover crop in days of the year (DOY). YYDOY where YY = last 2 digits of the year (e.g. 19 for 2019) and DOY is the day of the year (1-365) This dataset is provided annually starting in 2017 with 10 meter rasters (fully conformant with the EEA reference grid) in 100 x 100 km tiles covering the EEA38 countries. High Resolution Layer Croplands product is part of the European Union’s Copernicus Land Monitoring Service. Confidence layer available for the dataset. This dataset includes data from the French Overseas Territories (DOMs)
-
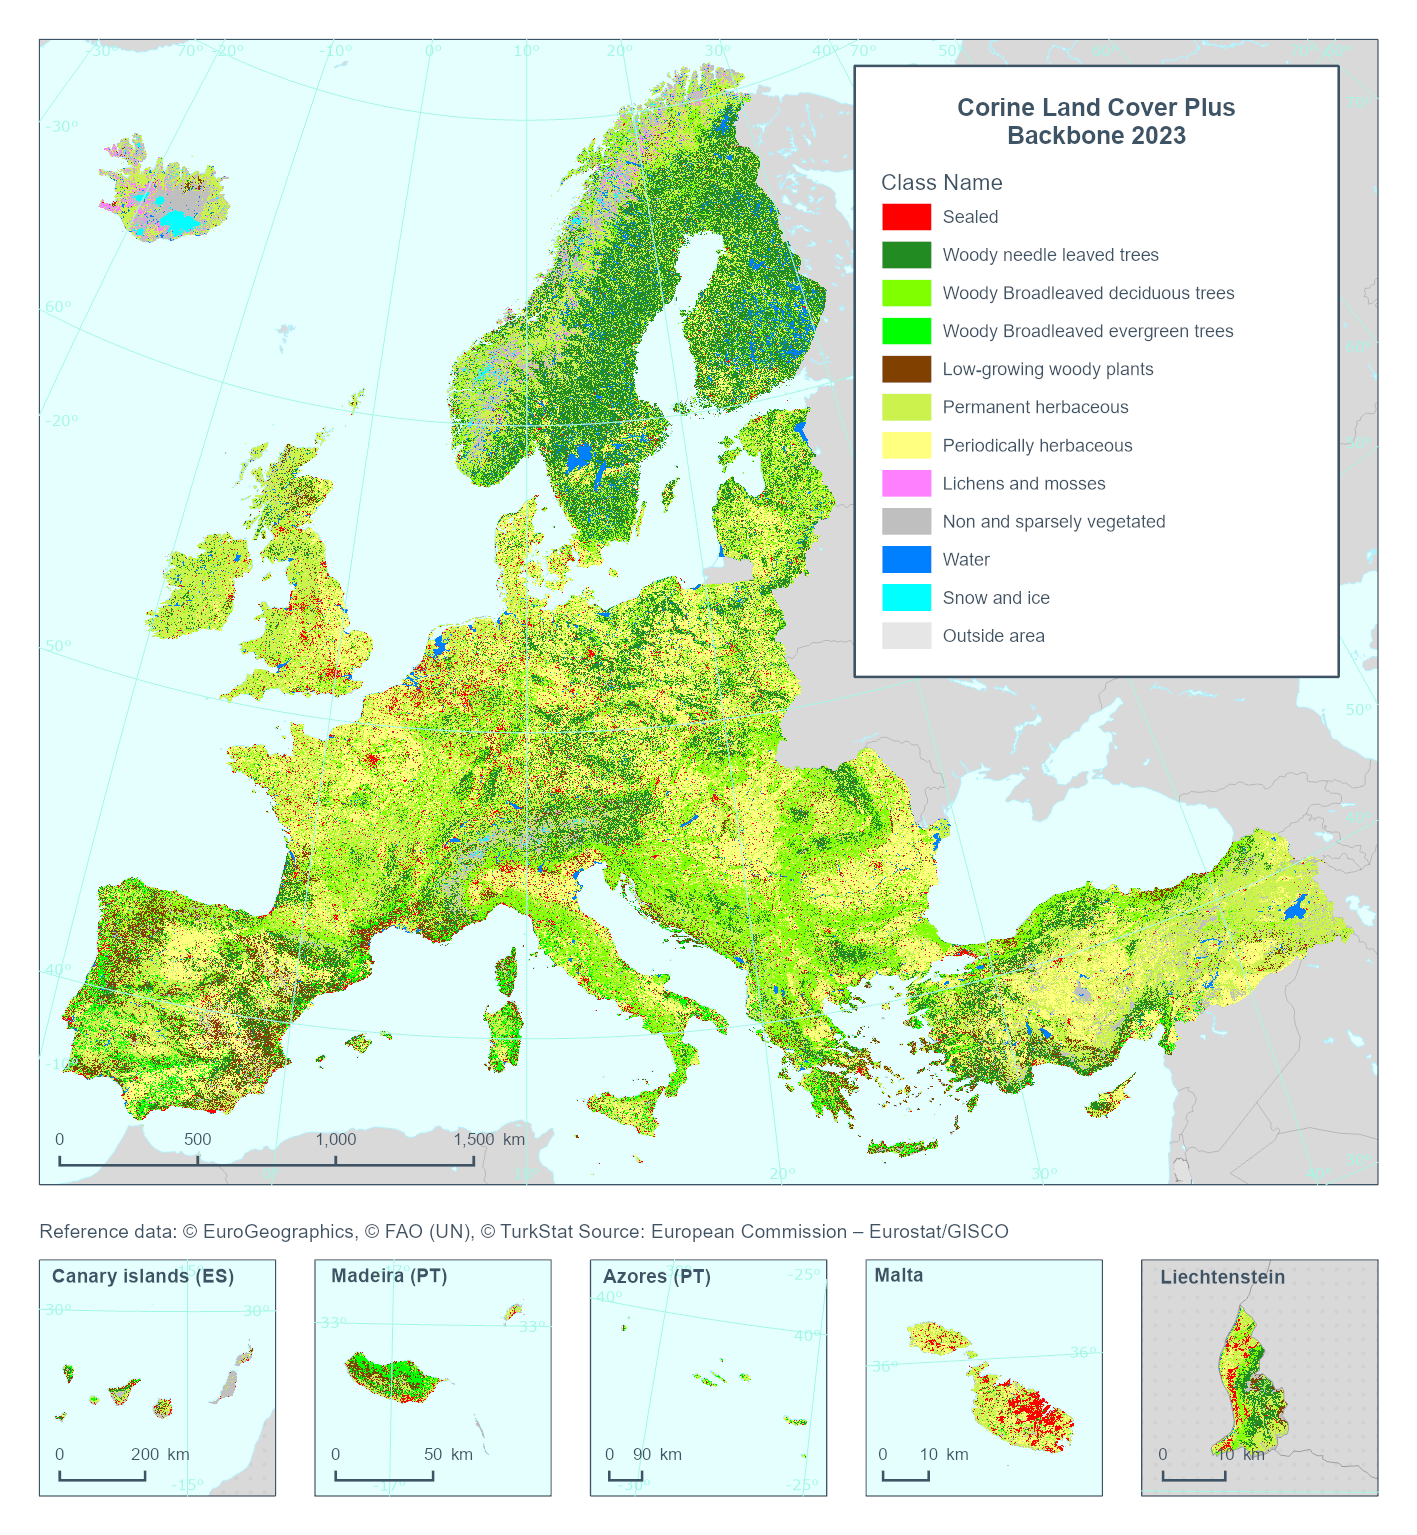
This metadata refers to the Corine Land Cover plus Backbone (CLCplus Backbone), a spatially detailed, large-scale, Earth Observation-based land cover inventory which is produced by the Copernicus Land Monitoring Service (CLMS). The CLCplus Backbone is a high-resolution raster land cover map based on Sentinel-2 satellite time series. Each 10m-pixel contains the dominant land cover among the 11 basic land cover classes. See pixel class codes in the 'Additional Information' section below. The product is available from the 2018 reference year, with a first update produced for the 2021 reference year and moved to an update cycle of 2 years from 2021 onwards.
-
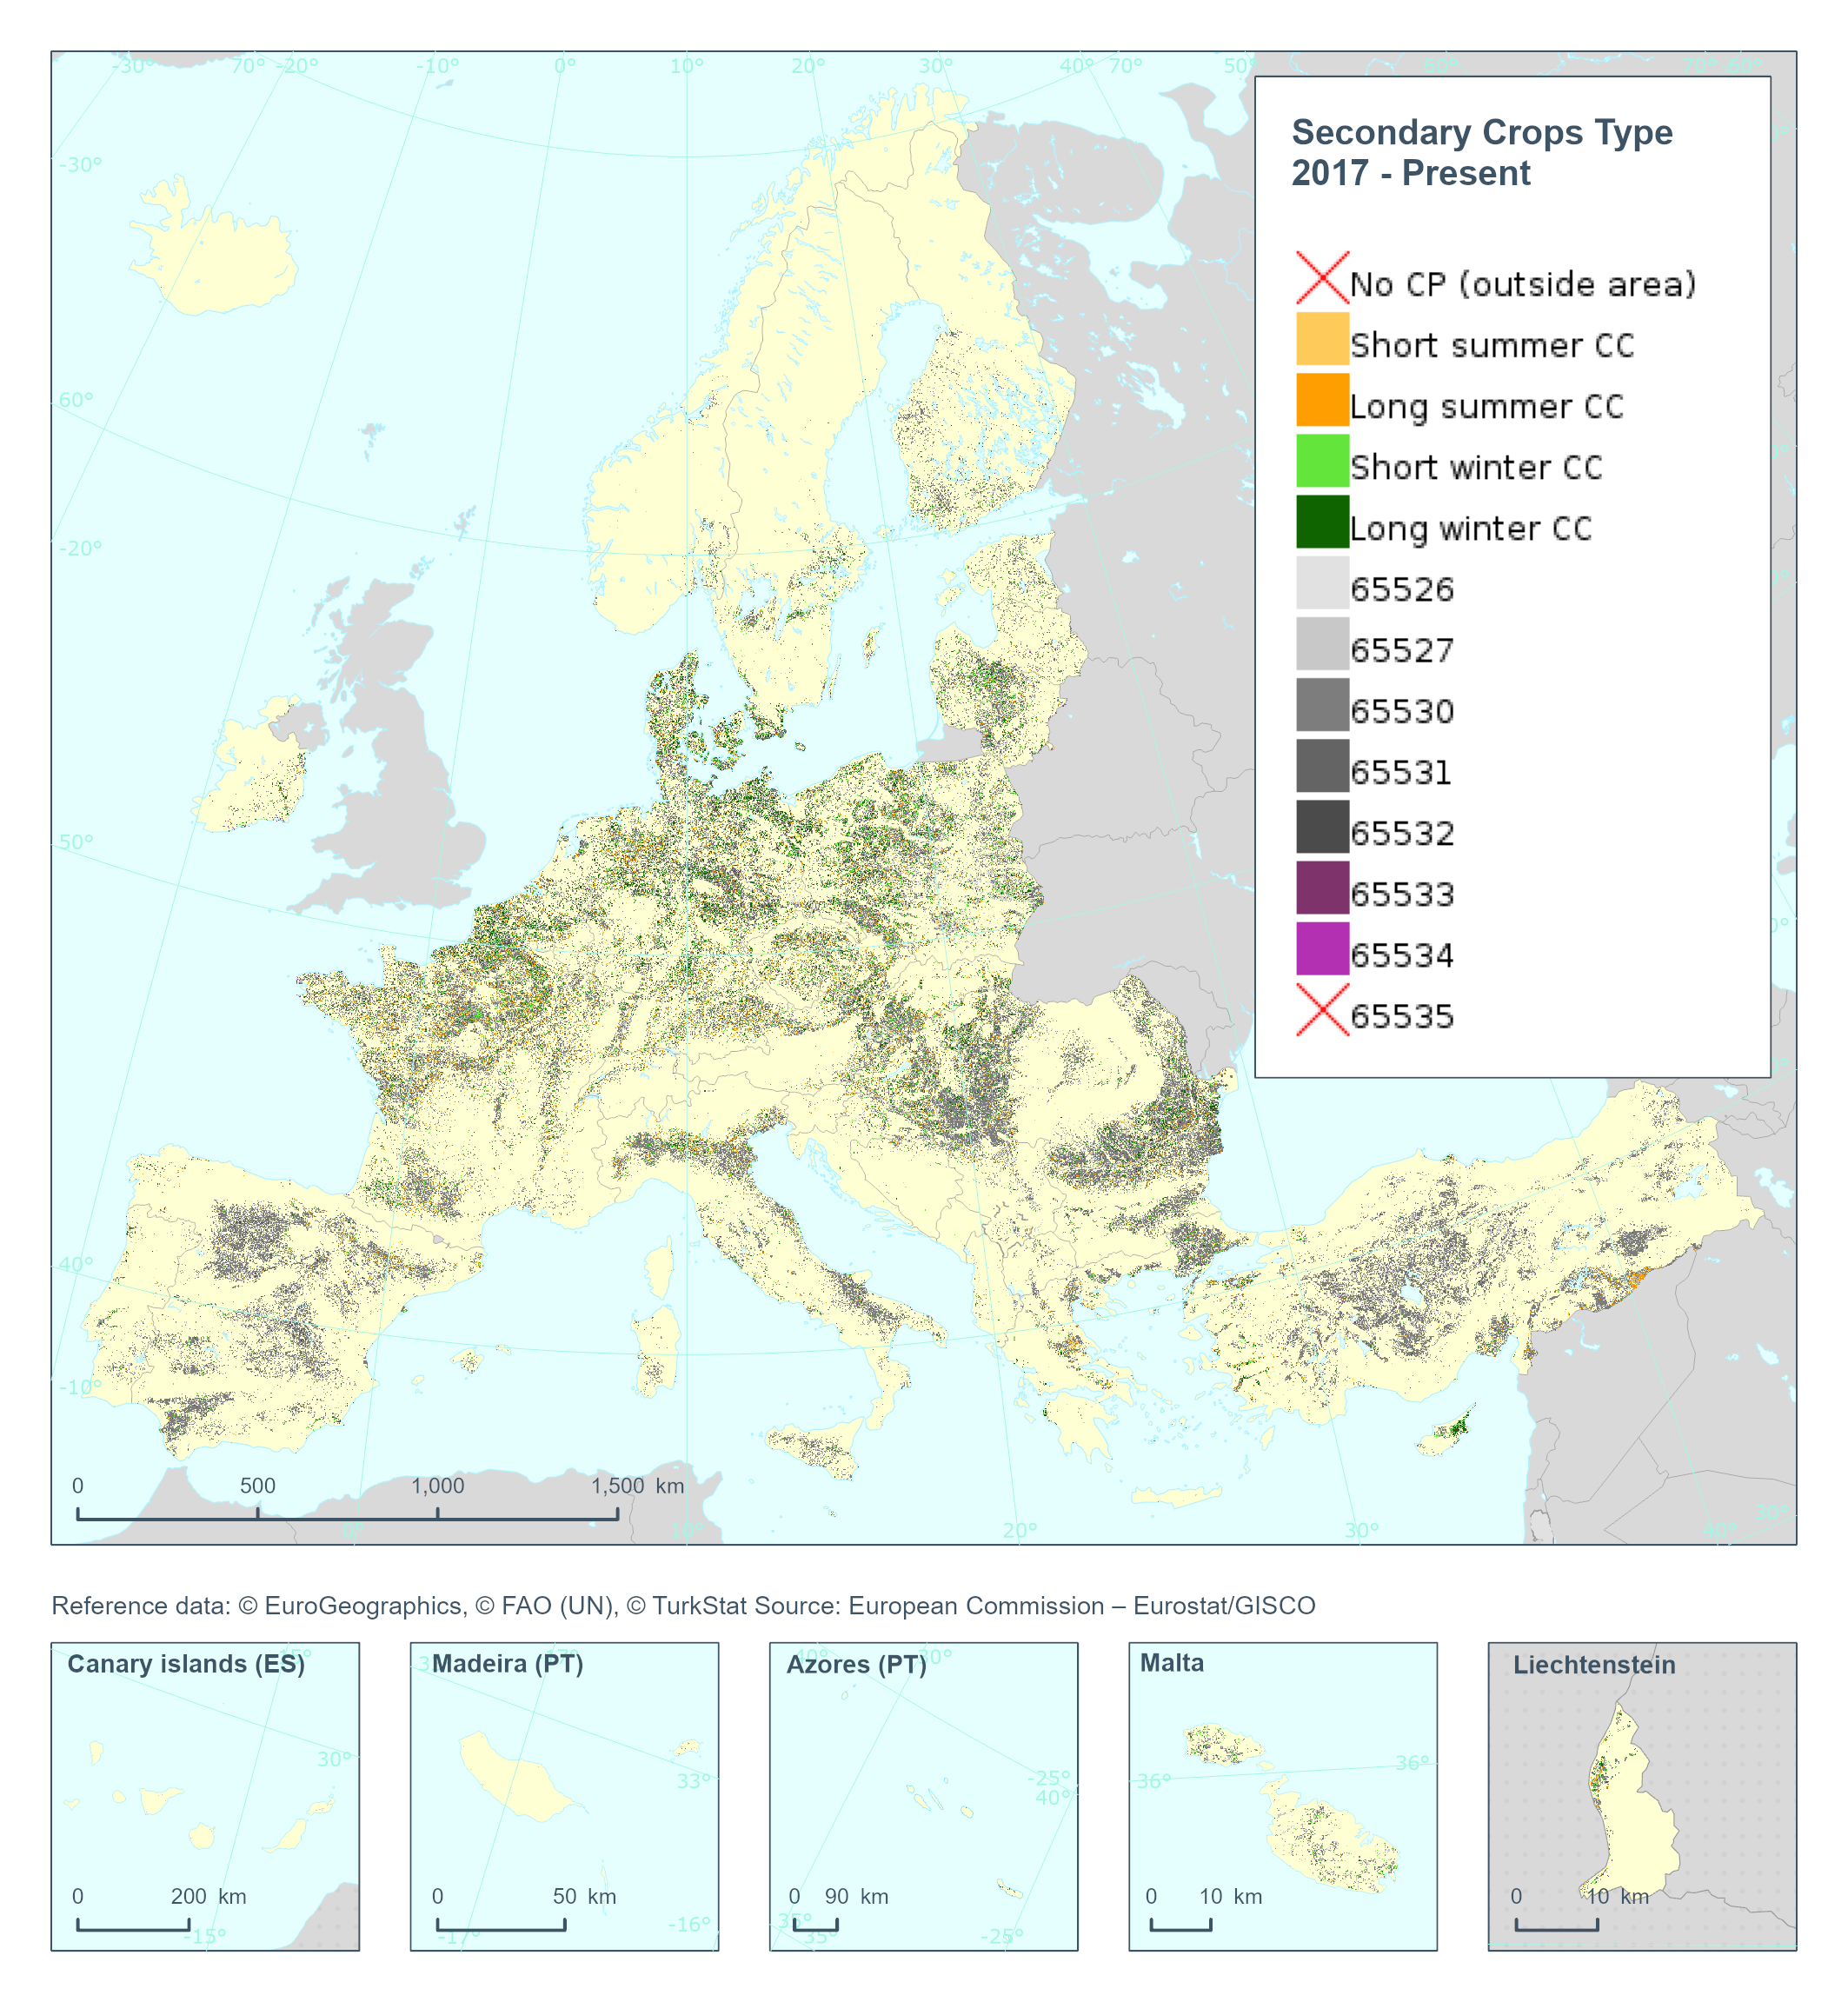
The High Resolution Layer Cropping Patterns - Secondary Crop Type (CPSCT) raster product indicates if a cover crop was present within the respective calendar year and further segregates the types of cover crop into: short summer, long summer, short winter and long winter cover crop. This dataset is provided annually starting in 2017 with 10 meter rasters (fully conformant with the EEA reference grid) in 100 x 100 km tiles covering the EEA38 countries. High Resolution Layer Croplands product is part of the European Union’s Copernicus Land Monitoring Service. Confidence layer available for the dataset. This dataset includes data from the French Overseas Territories (DOMs)
-
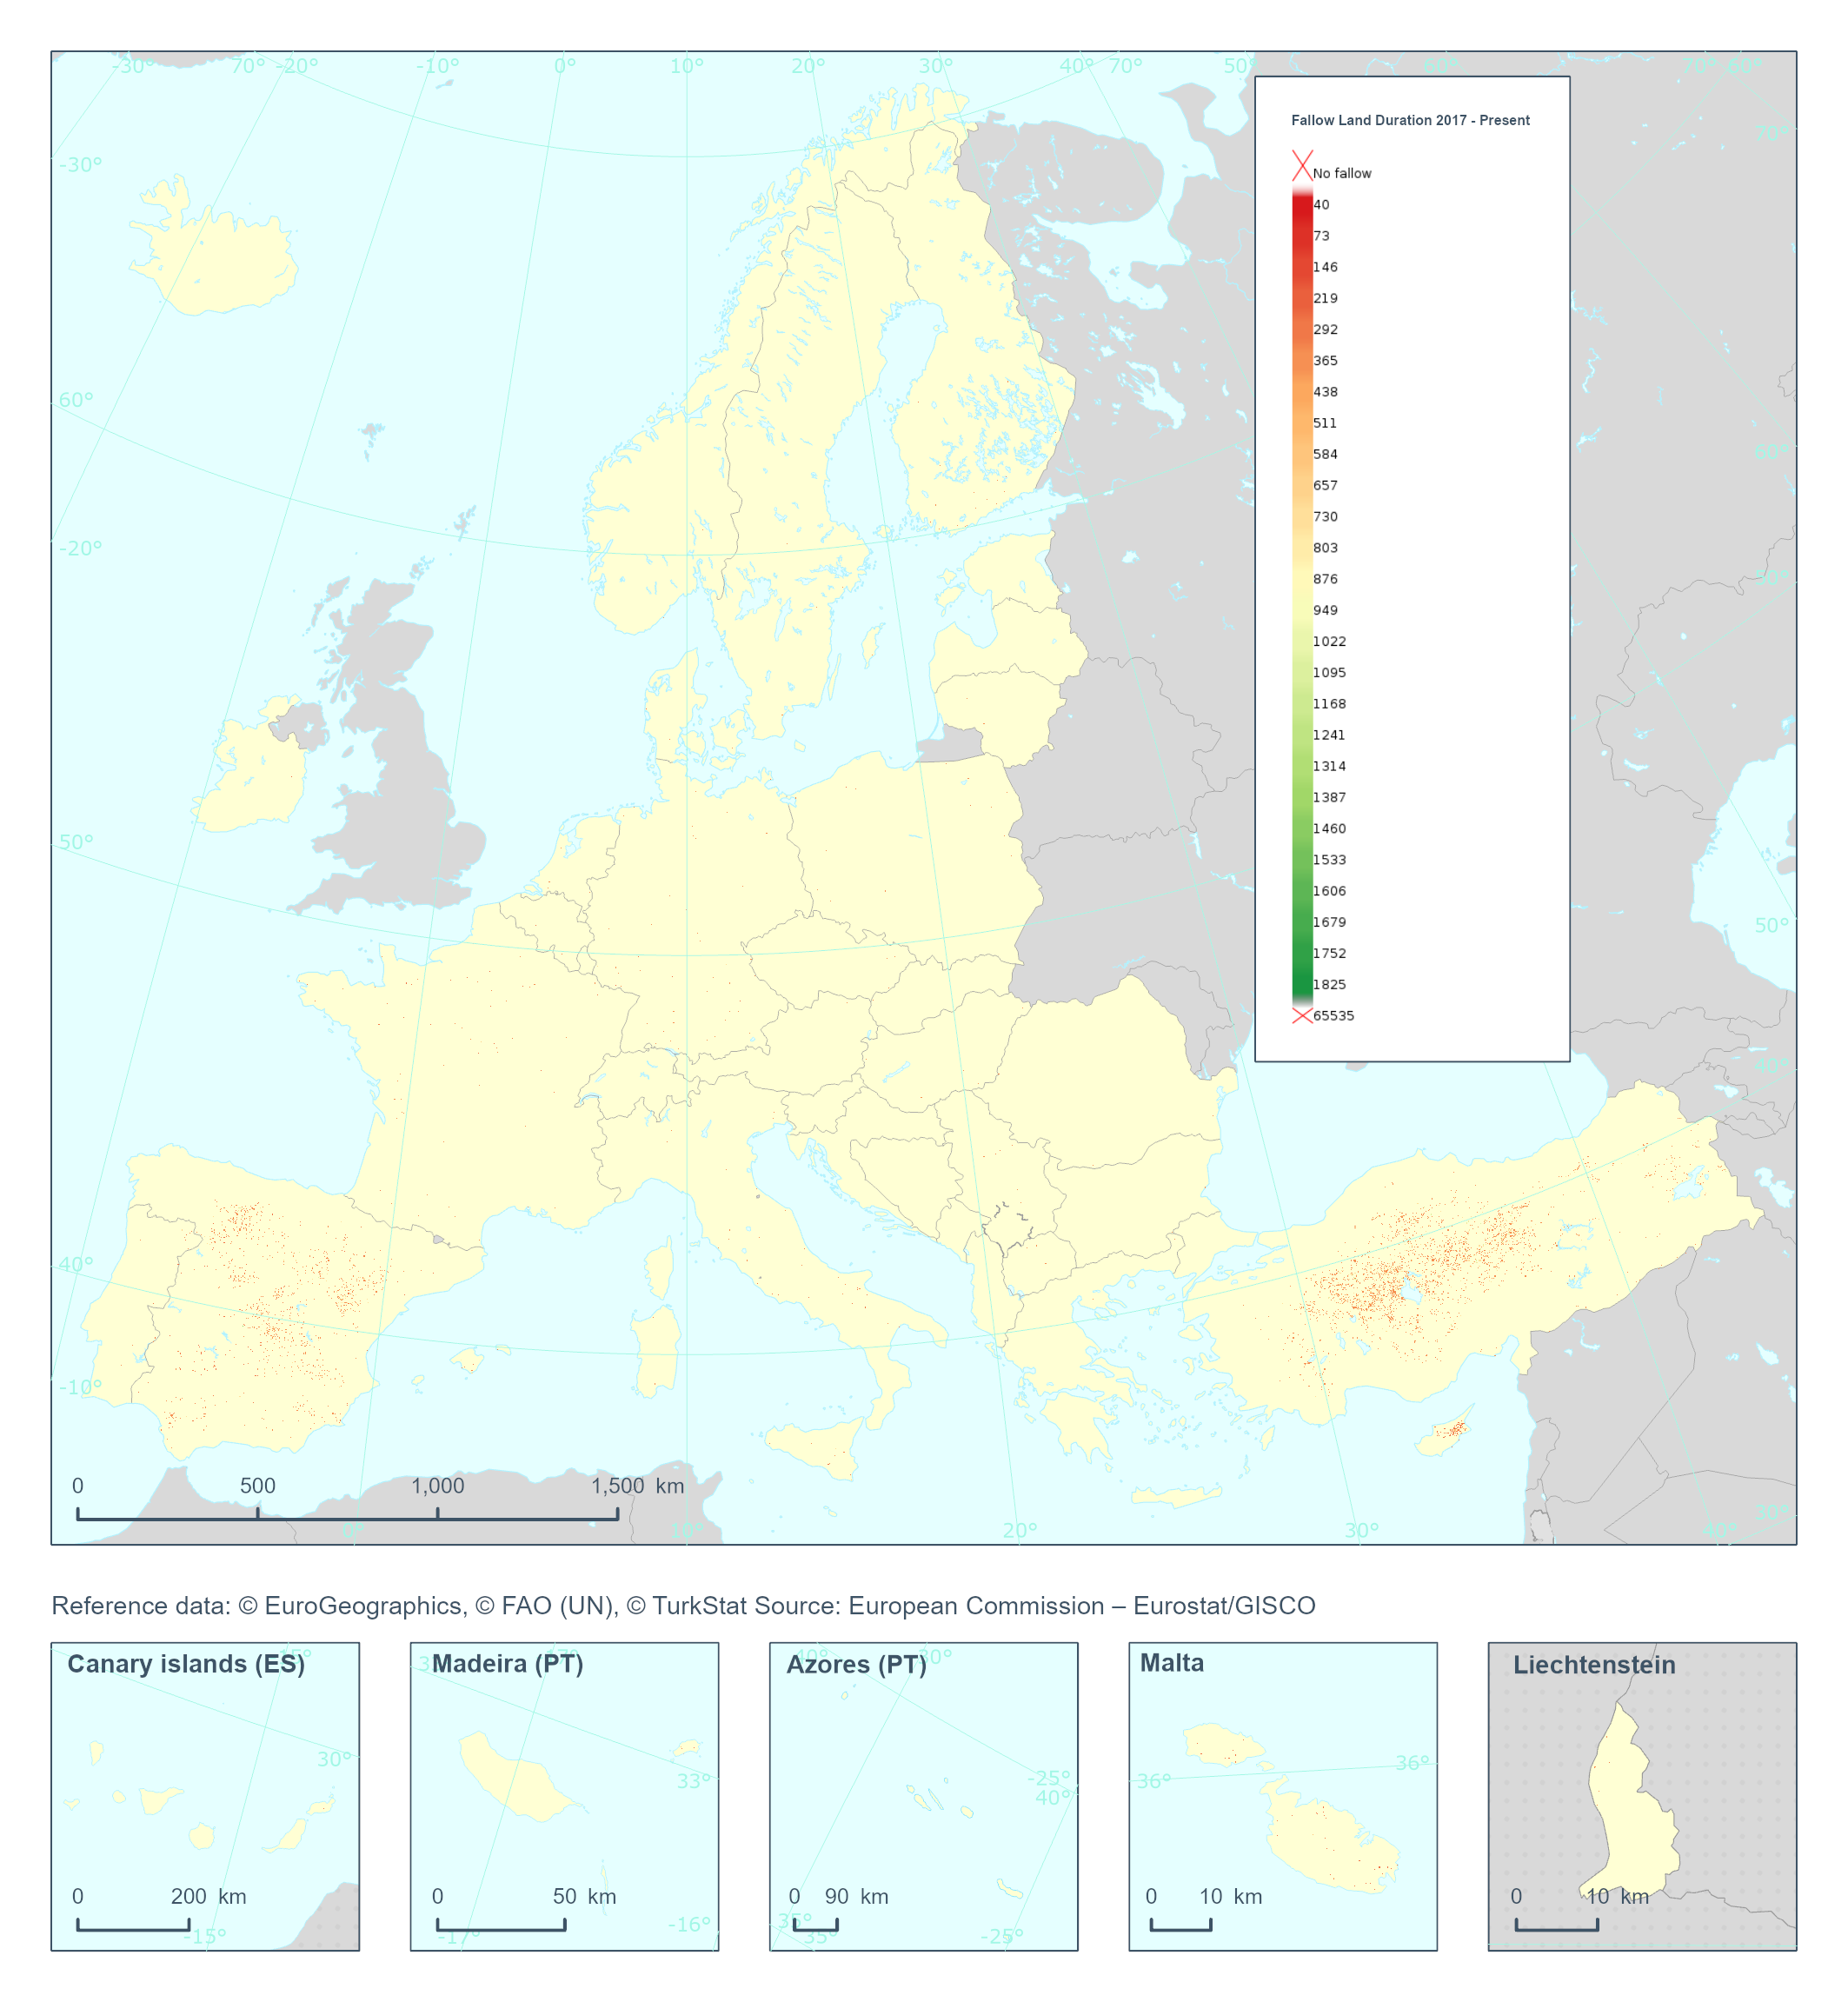
The High Resolution Layer Cropping Patterns - Fallow Land Duration (CPFLD) raster product provides information on the duration of fallow land periods, expressed in days, over a five-year period. This dataset is provided annually starting in 2017 with 10 meter rasters (fully conformant with the EEA reference grid) in 100 x 100 km tiles covering the EEA38 countries. High Resolution Layer Croplands product is part of the European Union’s Copernicus Land Monitoring Service. Confidence layer available for the dataset. This dataset includes data from the French Overseas Territories (DOMs)
-
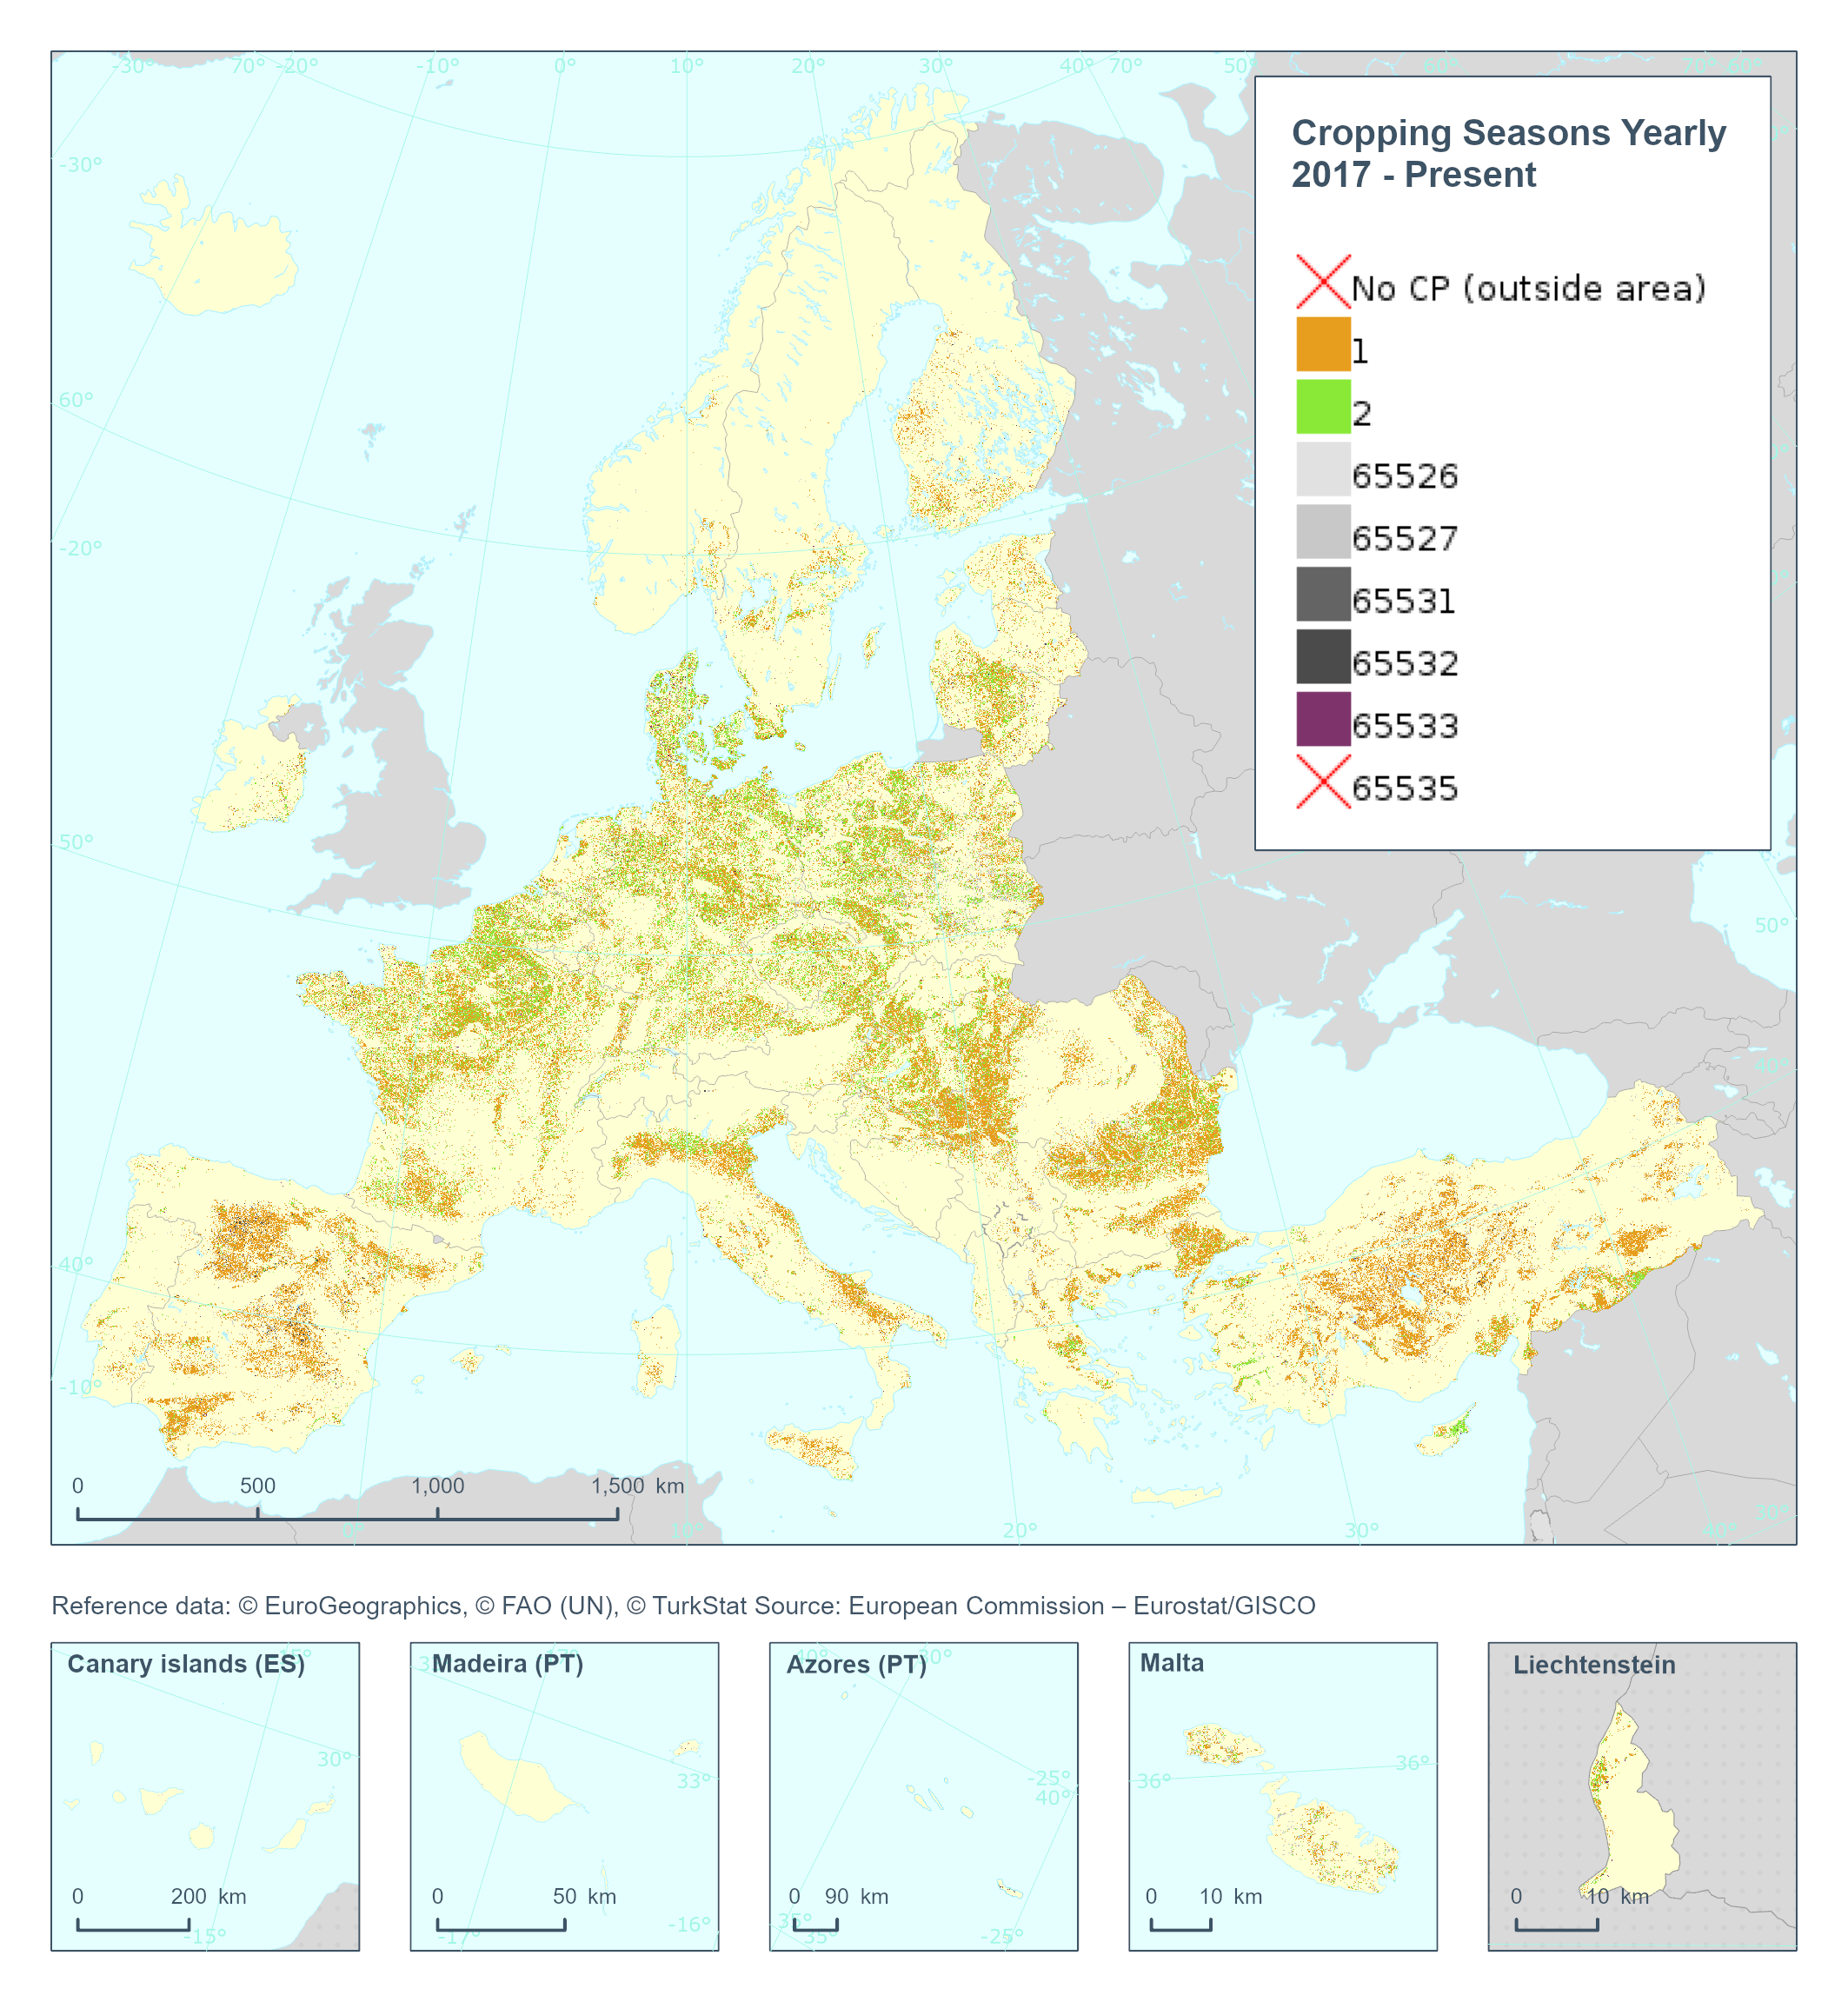
The High Resolution Layer Cropping Patterns - Cropping Seasons Yearly (CPCSY) raster product provides number of growing seasons detected within 1 year (0/1/2). This dataset is provided annually starting in 2017 with 10 meter rasters (fully conformant with the EEA reference grid) in 100 x 100 km tiles covering the EEA38 countries. High Resolution Layer Croplands product is part of the European Union’s Copernicus Land Monitoring Service. This dataset includes data from the French Overseas Territories (DOMs)
-
The European Ground Motion Service (EGMS) is a component of the Copernicus Land Monitoring Service. EGMS provides consistent, regular, standardised, harmonised and reliable information regarding natural and anthropogenic ground motion phenomena over the Copernicus Participating States and across national borders, with millimetre accuracy. This set of metadata describes the second product level of EGMS: Calibrated. This product is considered the main EGMS product as it serves the needs of most users. but the measurement points are referenced to a model derived from global navigation satellite system data. Thus, the measurements are not relative anymore and are considered as absolute. The calibrated product makes it possible to compare ground motion measurements from adjacent areas belonging to different products of the same level. EGMS Calibrated is visualised as a vector map of measurement points, colour-coded by average velocity, and distributed to users in comma-separated values format. Each point is associated with a time series of displacement, i.e. a plot with values of displacement per acquisition of the satellite. The product is generated for both ascending and descending orbits.
-
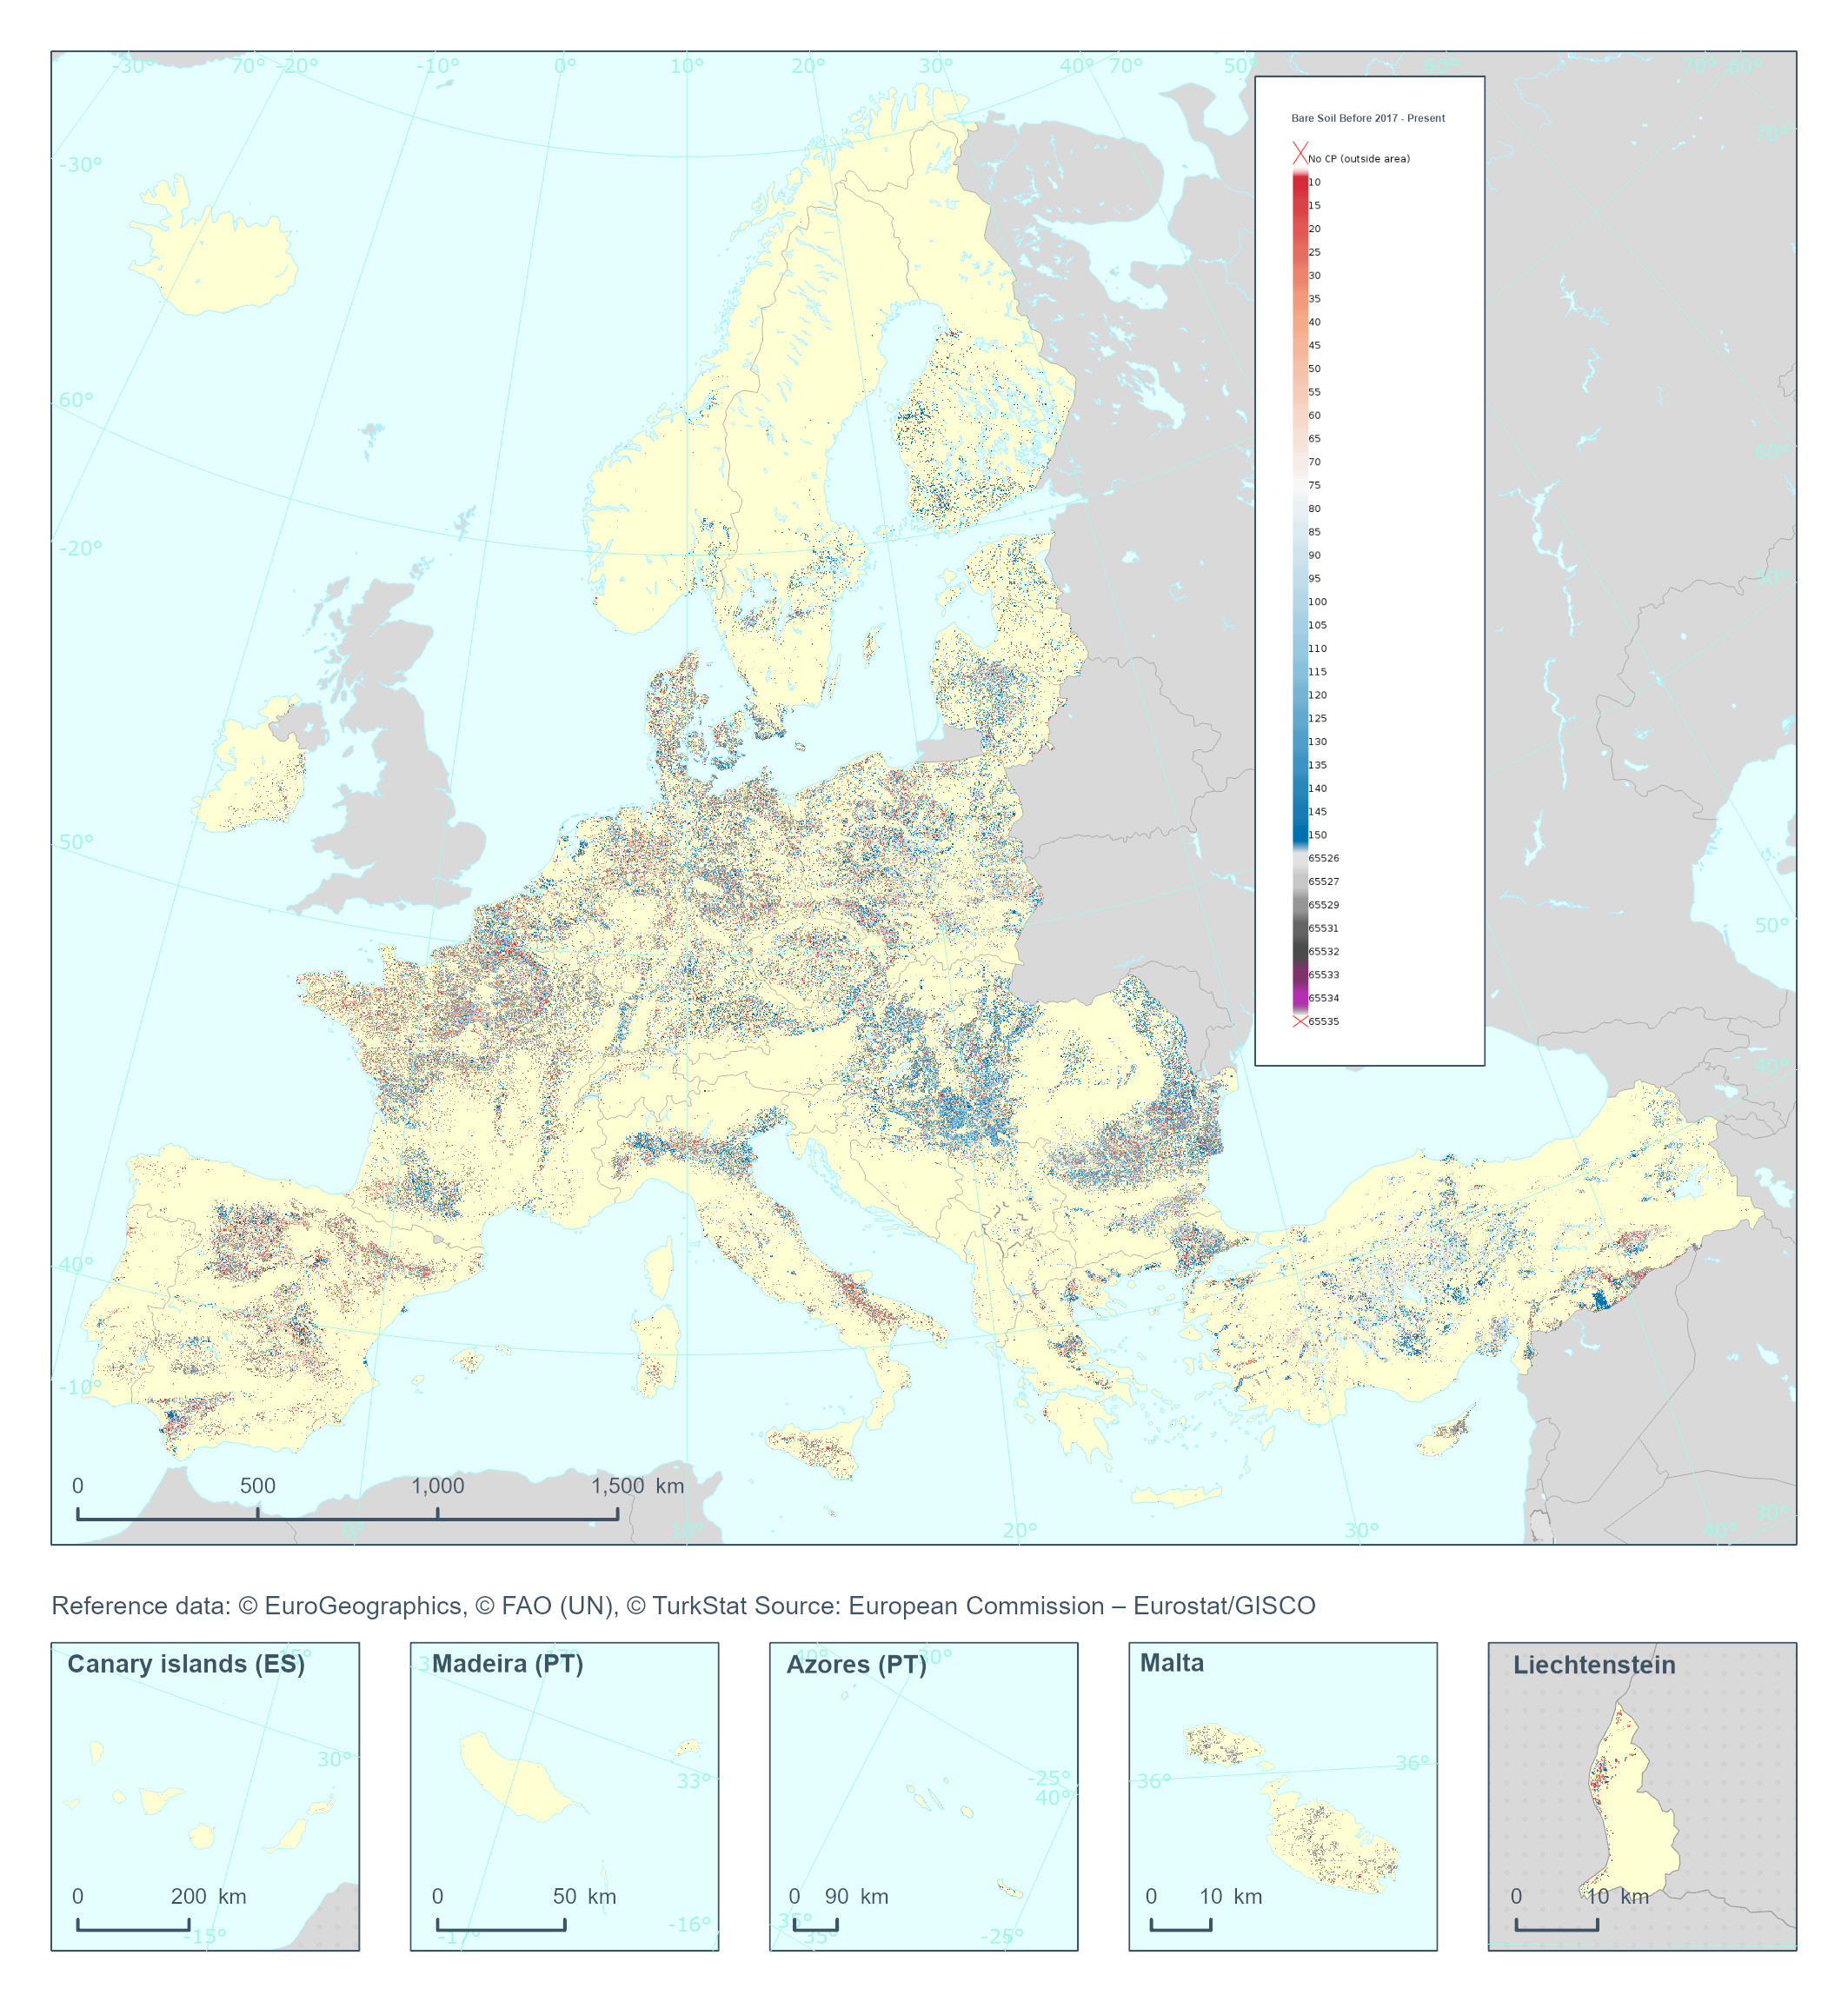
The High Resolution Layer Cropping Patterns - Bare Soil Before (CPBSB) raster product provides the bare soil period (in days) before the emergence of the main annual crop. Note that the bare soil period cannot transcend the calendar year for which the product is generated. This dataset is provided annually starting in 2017 with 10 meter rasters (fully conformant with the EEA reference grid) in 100 x 100 km tiles covering the EEA38 countries. High Resolution Layer Croplands product is part of the European Union’s Copernicus Land Monitoring Service. Confidence layer available for the dataset. This dataset includes data from the French Overseas Territories (DOMs)