 Arctic SDI catalogue
CSV
Type of resources
Available actions
Topics
Keywords
Contact for the resource
Provided by
Years
Formats
Representation types
Update frequencies
status
Scale
Resolution
-

This dataset provides projected 30-year, 50-year, and 100-year return levels for harbours in British Columbia by 2050 and 2100 under an intermediate emission scenario SSP245, relative to the mean sea level over 1993-2020. The return levels are a combination of estimated present extreme sea levels and projected mean sea level rise. The present extreme sea levels are derived from hourly coastal sea levels for the period from 1993 to 2020, simulated using a high-resolution Northeast Pacific Ocean Model (NEPOM). The projected mean sea level rise is derived from the regional mean sea level rise data of the IPCC 6th Assessment Report under SSP245, adjusted for the local vertical land motion.
-

This dataset provides projected 30-year, 50-year, and 100-year return levels for harbours in British Columbia by 2050 and 2100 under a high emission scenario SSP585, relative to the mean sea level over 1993-2020. The return levels are a combination of estimated present extreme sea levels and projected mean sea level rise. The present extreme sea levels are derived from hourly coastal sea levels for the period from 1993 to 2020, simulated using a high-resolution Northeast Pacific Ocean Model (NEPOM). The projected mean sea level rise is derived from the regional mean sea level rise data of the IPCC 6th Assessment Report under SSP585, adjusted for the local vertical land motion.
-
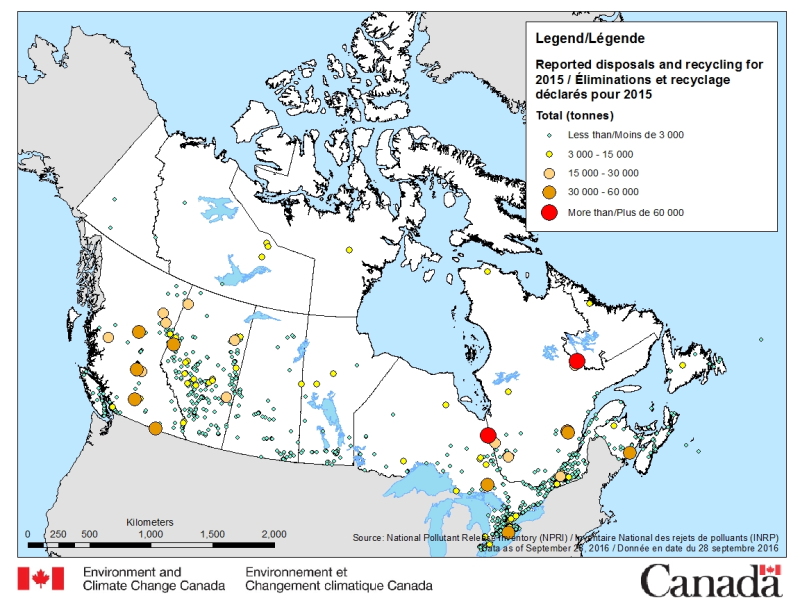
The National Pollutant Release Inventory (NPRI) is Canada's public inventory of pollutant releases (to air, water and land), disposals and transfers for recycling. The files below contain a map of Canada showing the locations of all facilities that reported disposals and transfers to the NPRI in the most recent reporting year, by reported total quantities. The map is available in both ESRI REST (to use with ARC GIS) and WMS (open source) formats. For more information about the individual reporting facilities, a dataset is available in an csv format. Please consult the following resources to enhance your analysis: - Guide on using and Interpreting NPRI Data: https://www.canada.ca/en/environment-climate-change/services/national-pollutant-release-inventory/using-interpreting-data.html - Access additional data from the NPRI, including datasets and mapping products: https://www.canada.ca/en/environment-climate-change/services/national-pollutant-release-inventory/tools-resources-data/exploredata.html
-
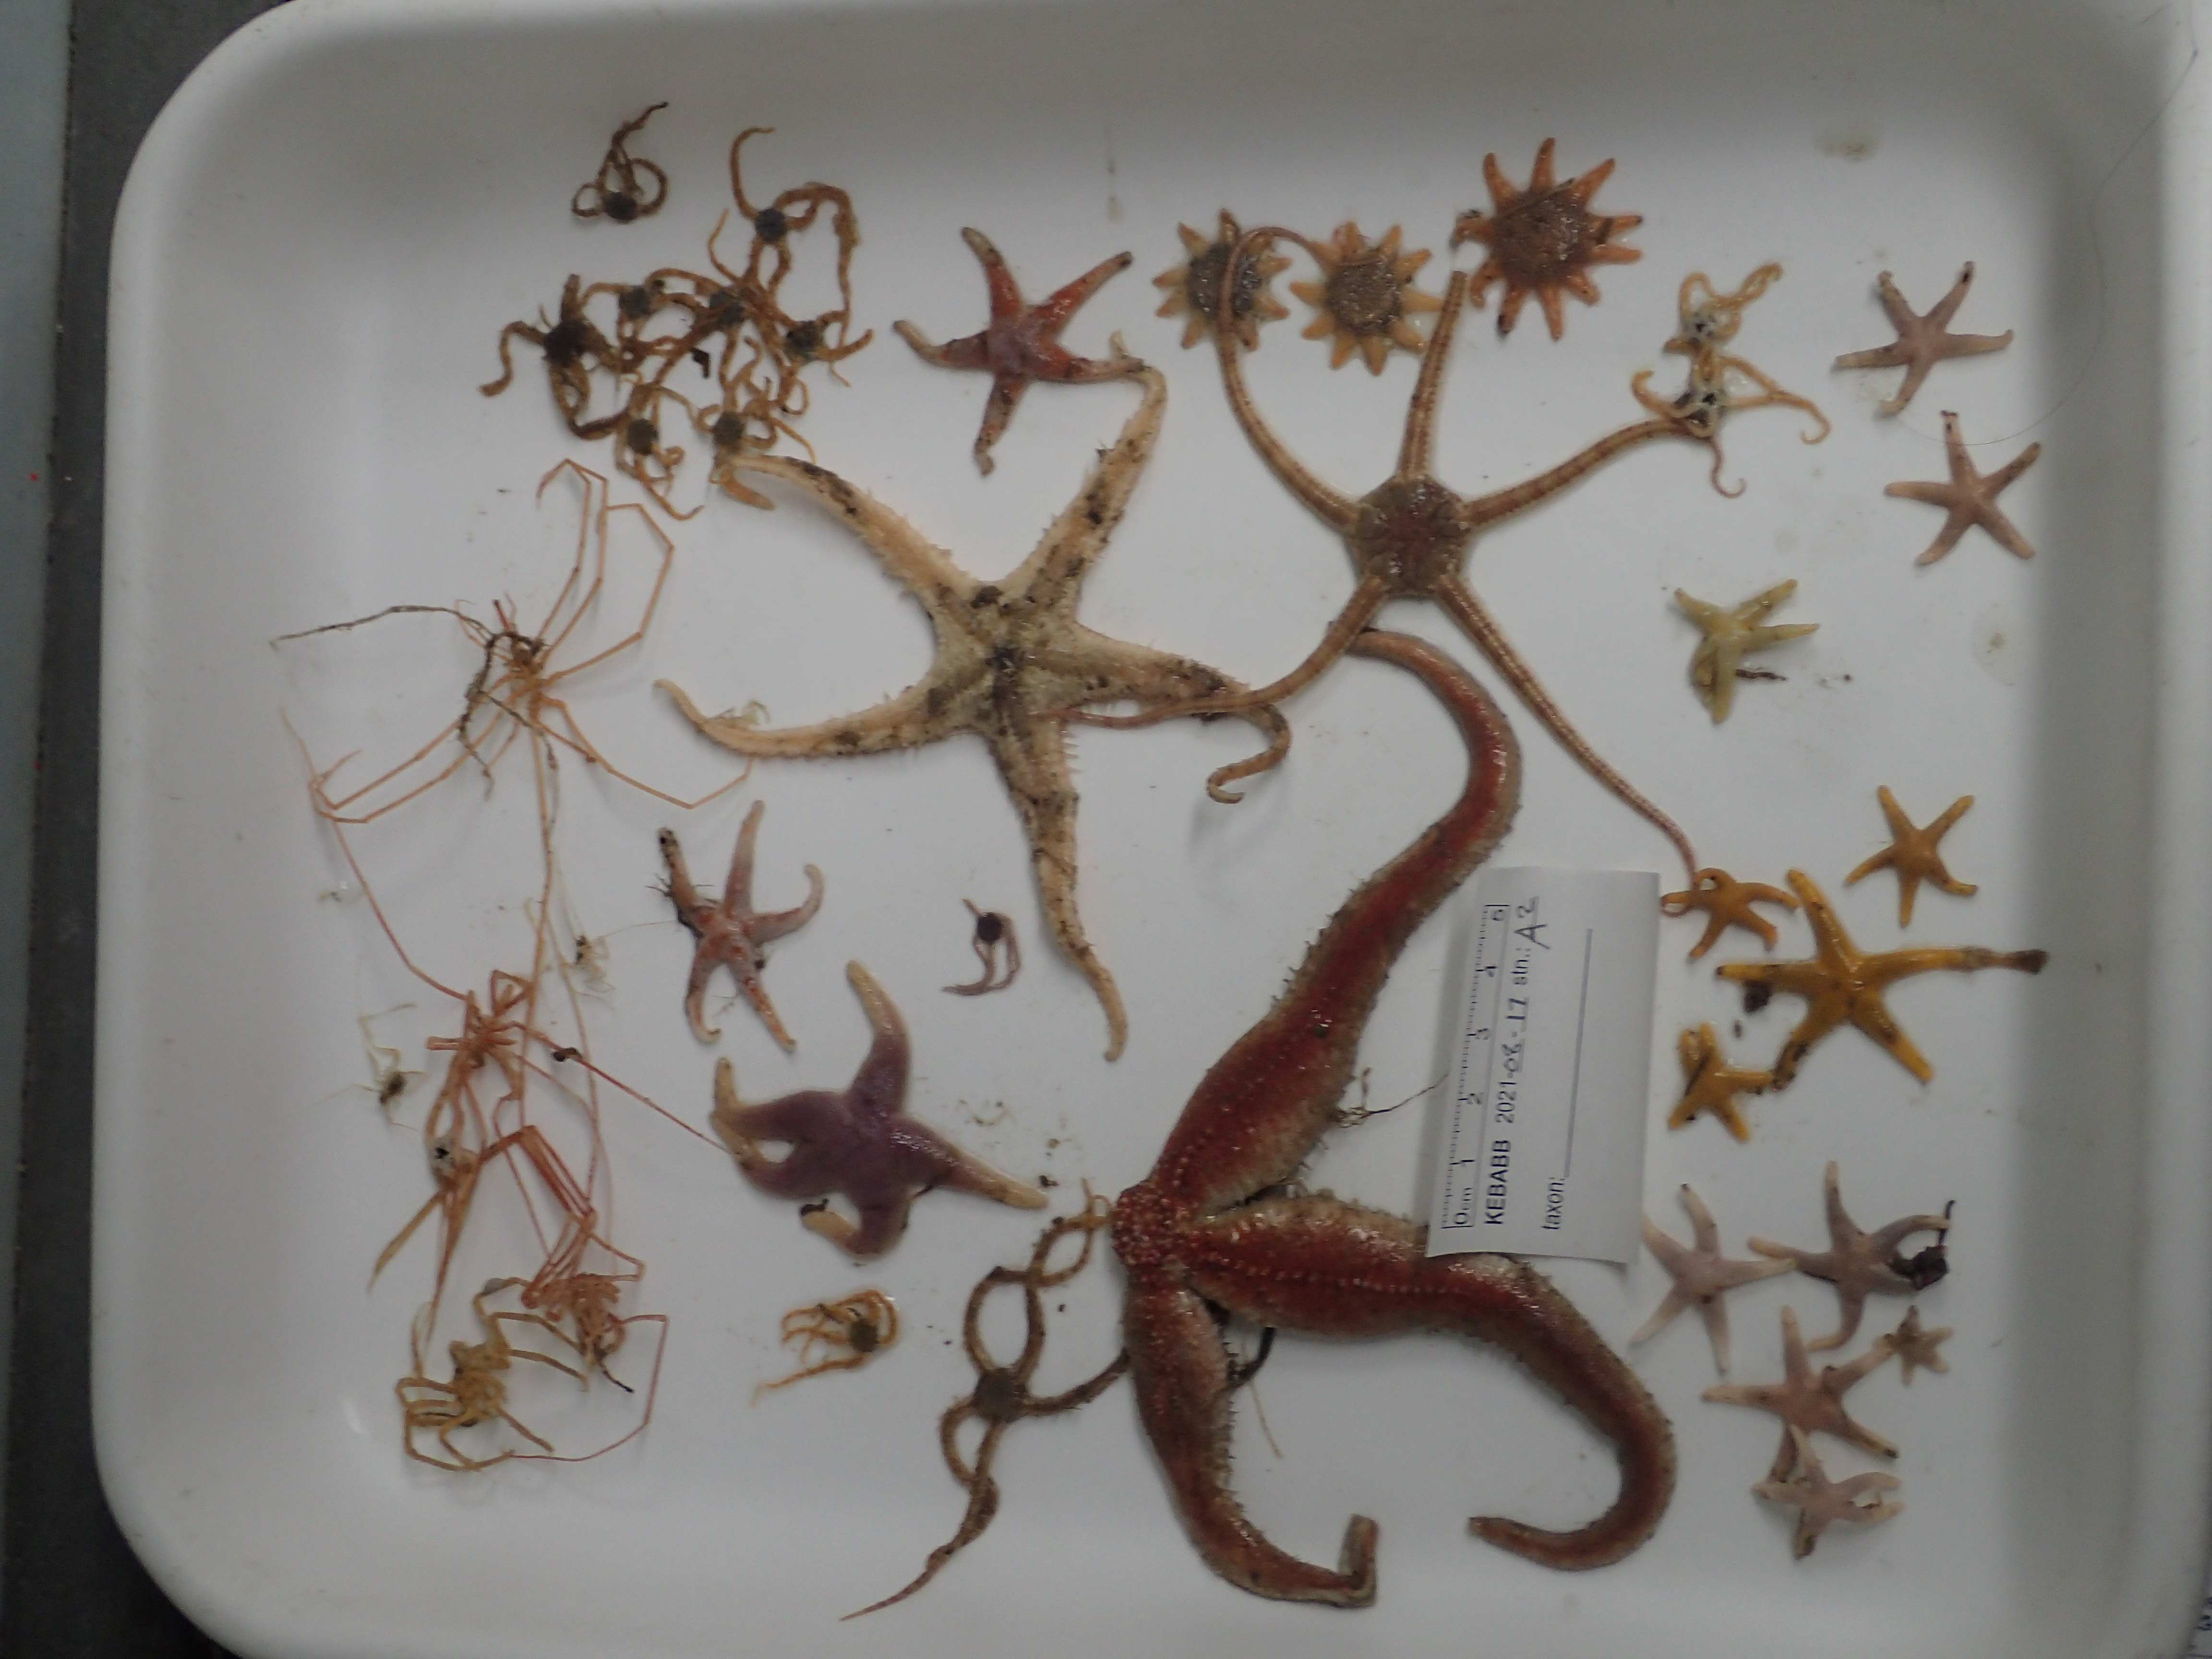
This resource documents a dataset of epifauna occurrences collected in 2021 during The Knowledge and Ecosystem-Based Approach in Baffin Bay (KEBABB) program developed by the Department of Fisheries and Oceans Canada (DFO) in collaboration with university partners. The overall objective of KEBABB is to characterize the variability and trends in physical, chemical, and biological oceanographic conditions and food webs supporting fisheries in the connected ecosystems of western Baffin Bay and Lancaster Sound. In 2021, DFO expanded the KEBABB program to Barrow Strait (KEBABS-Knowledge and Ecosystem-Based Approach in Barrow Strait), a key productive area of the Tallurutiup Imanga National Marine Conservation Area. The study took place in the Eastern Canadian Arctic (mainly in Baffin Bay, Davis Strait and Barrow Strait). Sampling is done along transects at fixed stations in the study area. Catches are collected with a 1.5 m Agassiz trawl (5 mm mesh net) for 3 minutes bottom-contact time at a target speed of 1.5 knots and with a 3 m benthic beam trawl (6.4 mm mesh net) for 15 minutes bottom-contact time at a target speed of 3 knots. A total of 16 stations were sampled for epifauna in 2021 between 85-850 m depth. Epibenthic invertebrates are identified to the lowest possible taxonomic level and photographed. All unknown specimens are frozen. In the lab, the identifications are validated or refined with the photos and the frozen specimens. The data are presented in Darwin Core and are separated in two files: The “Activité_épifaune_KEBABB_epifauna_event_en” file which contains information about missions, stations and deployments, which are presented under a hierarchical activity structure. The “Occurrence_épifaune_KEBABB_epifauna_en” file that contains the taxonomic occurrences. Further details on sampling can be found in the following report: Pućko, M., Charette, J., Tremblay P., Brulotte S., St-Denis B., Ciastek S., Hedges, K., Kuzyk, Z., Roy V., and Michel, C. 2022. An ecosystem-based approach in the eastern Arctic: KEBABB/S (Knowledge and Ecosystem-Based Approach in Baffin Bay/Barrow Strait) 2021 expedition report. Can. Manuscr. Rep. Fish. Aquat. Sci. 3250: viii + 58 p. https://publications.gc.ca/collections/collection_2022/mpo-dfo/Fs97-4-3250-eng.pdf USE LIMITATION: To ensure scientific integrity and appropriate use of the data, we would encourage you to contact the data custodian.
-
With the changing climate conditions, marine traffic along Canada’s coastal regions has increased over the past couple of decades and the need to improve our state of preparedness for oil-spill-related emergencies is critical. Baseline coastal information, such as shoreline form, substrate, and vegetation type, is required for prioritizing operations, coordinating onsite spill response activities (i.e. Shoreline Cleanup Assessment Technique [SCAT]), and providing information for wildlife and ecosystem management. Between 2010 and 2019, georeferenced high-definition videography and photos were collected for various study sites across coastal Canada. The study areas include Beaufort Sea, Mackenzie Delta channels and Banks Island in the western Canadian Arctic; James Bay, Hudson Bay, Nunavik, Resolute Bay, Victoria Strait, Baffin Island and Coronation Gulf in the eastern Canadian Arctic; Labrador, Bay of Fundy and Chedabucto Bay in Atlantic Canada and Kitimat, Haida Gwaii, North Vancouver Island, Mainland BC and Burrard Inlet in the northern Pacific. Data was collected during ice-free and low tide conditions (where applicable) between July and September. Low-altitude helicopter surveys were conducted at each study site to capture video of the shoreline characteristics. In addition to acquiring videography, ground-based observations were recorded in several locations for validation. Shoreline segmentation was then carried out by manual interpretation of the oblique videography and the photos aided by ancillary data. This involved splitting and classifying the shoreline vectors based on homogeneity of the upper intertidal zone. Detailed geomorphological information (i.e. shoreline type, substrate, slope, height, accessibility etc.) describing the upper intertidal, lower intertidal, supratidal and backshore zones was extracted from the video and entered into a geospatial database using a customized data collection form. In addition, biological characteristics like biobands, water features, fauna, human use etc. observed along the coast were recorded. The data was also validated through ground samples (when available) and a second interpreter QA (quality analysis) was performed on each dataset (excluding Nunavik) to ensure high quality and consistency. The final dataset contains segments ranging in length from 150 m to 2500 m (except Nunavik). The minimum segment length is 45 m for study areas in the west coast that were surveyed in 2018-2019. In total, about 33,700 km of shoreline were segmented within all the survey zones.
-

PURPOSE: To provide access to detailed stomach content data and associated metadata from Atlantic Bluefin Tuna sampled in the southern Gulf of St. Lawrence from 2018 to 2023. These data support fisheries science by contributing to analyses of predator–prey dynamics, diet composition, and ecosystem understanding, as well as informing stock assessment and fisheries management activities within Fisheries and Oceans Canada. DESCRIPTION: This dataset contains metadata and stomach content information collected from Atlantic Bluefin Tuna (ABFT) caught from mid-August to late September in the commercial fishery in the southern Gulf of St. Lawrence between 2018 and 2023. Stomach samples were primarily obtained from fish harvested near the eastern end of Prince Edward Island, with additional samples collected from the Miscou/Baie‑des‑Chaleurs area in 2018 and 2019. SAMPLING METHODS: Fish were measured to the nearest curved fork length (cm) and weighed to the nearest round weight (kg). Stomachs were obtained directly from harvesters or through a fish buyer and were stored at −20 ◦C before being processed in the laboratory. Stomachs identification numbers were cross-referenced with ABFT tag numbers recorded by fish provider in order to obtain logbook and port data (catch location, time, weight length, sex, gear, etc.) for each sample. Stomachs were thawed in the laboratory and the content was sorted and identified to the lowest possible taxonomic level. For each stomach, prey were weighed collectively as a taxonomic group and individually to the nearest 0.1 g. Dead bait used to capture ABFT, identified by cut marks, were recorded and weighed but excluded from the analysis. Live bait items cannot be identified from stomach content analyses. Only a few otoliths were found in 2018 and their degraded quality precluded performing ageing or species identification. Rare and small prey items such as algae and rocks were classified in the category “other”. Fish remains that could not be identified were classified in the category “Unidentified teleostei remains”. For 2019 to 2023, when stomach content items could not be visually identified and when tissue was available, tissue samples were collected and stored at −20 °C for DNA barcoding analysis. DNA extraction, mitochondrial cytochrome oxidase subunit 1 amplification, Sanger sequencing and species assignation were performed at the Plateforme d’Analyses Génomiques and Plateforme Bio-informatique of the Institut de Biologie Intégrative et des Systèmes (PAG-IBIS, Université Laval, Quebec city, QC, Canada, http://www.ibis.ulaval.ca/en/services-2/genomic-analysis-platform/). DNA was extracted from 20 mg of muscle tissue using the Omega Bio-tek E-Z-96 Tissue DNA Kit (Omega Bio-tek, Norcross GA, USA) following manufacturer instructions. The mitochondrial cytochrome oxidase subunit 1 region was amplified and sequenced as described in Hashemzadeh Segherloo et al., 2021). Sanger forward and reverse reads were analyzed independently using the Basic Local Alignment Search Tool against non-redundant sequences to identify the top hit for each sequence. When samples could not be identified by a top hit sequence they were classified as “unidentifiable fish”. Prey items that were successfully identified using DNA barcoding were incorporated into the stomach content analysis database and used in all subsequent diet analyses (abundance, occurrence and weight). The weight of the items used in the database was the weight of the remains as they were, and not reconstructed weights calculated for a live animal of the species identified by the barcoding. USE LIMITATION: To ensure scientific integrity and appropriate use of the data, we would encourage you to contact the data custodian.
-
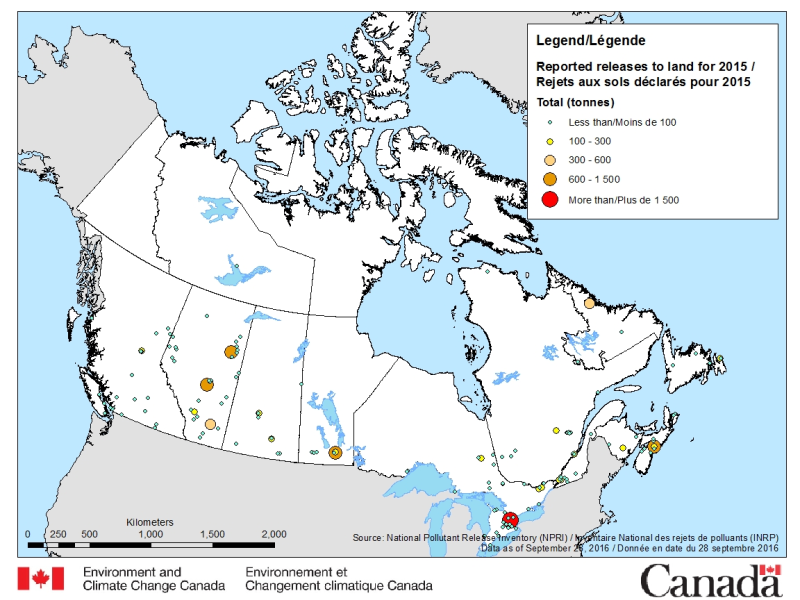
The National Pollutant Release Inventory (NPRI) is Canada's public inventory of pollutant releases (to air, water and land), disposals and transfers for recycling. The files below contain a map of Canada showing the locations of all facilities that reported direct releases to land to the NPRI. The data are for the most recent reporting year, by reported total quantities of these releases. The map is available in both ESRI REST (to use with ARC GIS) and WMS (open source) formats. For more information about the individual reporting facilities, a dataset is available in a CSV format. Please consult the following resources to enhance your analysis: - Guide on using and Interpreting NPRI Data: https://www.canada.ca/en/environment-climate-change/services/national-pollutant-release-inventory/using-interpreting-data.html - Access additional data from the NPRI, including datasets and mapping products: https://www.canada.ca/en/environment-climate-change/services/national-pollutant-release-inventory/tools-resources-data/exploredata.html
-

PURPOSE: These data have been updated following a Canadian Science Advice Secretariat (CSAS) Regional Science Advisory Process. Associated publications are available in the citation section below or will be posted on the Fisheries and Oceans Canada (DFO) Science Advisory Schedule as they become available. DESCRIPTION: The yearly biomass estimates of Gulf of St. Lawrence Witch Flounder were obtained using a Bayesian Schaefer Surplus Production model as part of the stock assessment to year 2021. The yearly estimates presented come from Markov Chain Monte Carlo (MCMC) simulations. The yearly median estimates are provided, along with uncertainty estimates (2.5th, 25th, 75th and 97.5th percentiles). The values are in thousands of tons of 30+ cm biomass. USE LIMITATION: To ensure scientific integrity and appropriate use of the data, we would encourage you to contact the data custodian.
-

Fisheries and Oceans Canada (DFO) conducts an annual summer multidisciplinary scientific survey with a bottom trawl in the Estuary and the northern Gulf of St. Lawrence since 1984. Over the years, this survey has been conducted on four vessels: the MV Lady Hammond (1984-1990), the CCGS Alfred Needler (1990-2005), the CCGS Teleost (2004-2021) and the CCGS Cabot (2022-current). It is important to note that the objectives, the methods used and the identification of the species during these surveys have improved over time in response to DFO requests and mandates. The data are therefore not directly comparable between these surveys. The specificities of the missions onboard the MV Lady Hammond are described below. Objectives: 1. Assess groundfish populations abundance and condition 2. Assess environmental conditions 3. Conduct a biodiversity inventory of benthic and demersal megafauna 4. Monitor the pelagic ecosystem 5. Collect samples for various research projects Survey description The survey covers the northern Gulf of St. Lawrence, that is the divisions 4R, 4S and the northern part of division 4T of the Northwest Atlantic Fisheries Organization (NAFO). A stratified random sampling strategy is used for this survey and the fishing gear used on the MV Lady Hammond is a bottom trawl Western IIA. Standard trawling tows last 30 minutes, starting from the time the trawl touches the sea floor. Towing speed is 3.5 knots. Data For each fishing tow, the catch is sorted and weighed by taxa; individuals are counted and biological data are collected on a sub-sample. For fish, crab and squid, size and weight are measured by individual and, for some species, sex, gonad maturity, and the weight of certain organs (stomach, liver, gonads) are also evaluated. The soft rays of the anal fin are counted for redfish and otoliths are collected for redfish and Atlantic cod. Invertebrates are weighted and counted (no individual measurements). The biological data are divided into 4 files: a “Metadata” file containing set information, a “Catches” file containing catches per set for fish taxa, a “Carbio” file containing biological and morphometric measurements per individual and a “Freql” file containing the length frequency of fish. It's important to note that this is raw data. Only sets considered successful are retained. In each set, all species are kept, with a few exceptions. For more information please contact the data management team (gddaiss-dmsaisb@dfo-mpo.gc.ca).
-

In place since fall 1994, the sentinel fisheries program is the result of a collaboration between Fisheries and Oceans Canada (DFO) and Quebec and Newfoundland commercial fishermen's associations. Under this program, contracts are awarded by tender to fishermen’s associations to carry out fishing activities according to scientific protocols developed by DFO. The main objective of this survey is to collect data that will be used to calculate abundance indices for various fish stocks, including cod, Greenland halibut, Atlantic halibut and rockfish. Description of mobile survey The mobile gear sentinel fisheries of the northern Gulf of St. Lawrence are conducted in the sub-division 3Pn and the divisions 4R, 4S and the northern part of the division 4T of the Northwest Atlantic Fisheries Organization (NAFO). This program follows a stratified random survey plan according to depth strata, NAFO divisions and the type of substrate at the bottom. A standard tow is 30 minutes long and made at a speed of 2.5 knots. The fishing gear is a 300 Star Balloon trawl mounted on a Rock Hopper footgear. The trawl mesh size is 145 mm with a liner of 40 mm in the codend. Unless conditions at sea compromise safety during fishing activity, a retaining cable must be used to standardize the horizontal opening between vessels and the various depths fished. Data are collected by observers at sea or by technicians. The data contained in this program are divided into 4 different projects. -The summer series, carried out during the month of July -The fall series, which covers the period from 1995 to 2002 -The winter series, to study the mixing between the different stocks -The CRP (Cod reproductive potential) series, which targets the reproductive potential. Data For each trait, the total catch is sorted and weighed for each species. The number of individuals caught for each unmeasured fish species is noted. Biological data such as length, weight (sampled, per individual, gonad, liver and stomach), age, sex and maturity migth then be collected on a subsample of many species such as Atlantic halibut, Greenland halibut, lumpfish and Atlantic cod, using a variety of protocols. The biological data are divided into 4 files: a “Metadata” file containing set information, a “Catches” file containing catches per set for fish taxa, a “Carbio” file containing biological and morphometric measurements per individual, a “Freql” file containing the length frequency of fish. The data collected as part of this program is available below. It is important to note, however, that 1) only traits deemed successful have been retained; 2) historical data may contain inaccuracies; 3) the most recent survey is not available for validation purposes.