 Arctic SDI catalogue
FGDB/GDB
Type of resources
Available actions
Topics
Keywords
Contact for the resource
Provided by
Formats
Representation types
Update frequencies
status
Scale
Resolution
-
This collection holds the layers used for the "Map of Upper Intertidal shoreline segmentation with Shoreline Cleanup Assessment Technique (SCAT) classification", a WMS service maintained by ECCC. The segmentation covers shorelines for Northern Canada, the North coast of British Columbia, as well as Ontario, Quebec, and Atlantic regions.
-

These datasets show the general spatial distribution of commercial fishing harvest and landed values by fishery on a 1km x 1km planning grid. They aggregate key statistics around fleet specific fishing activity and catch in British Columbia (BC) within the exclusive economic zone (EEZ). These gridded data describe the annual average landed weight (Rounded KGs), and landed catch values (CAD $2016) of the subject fishery over the period. The data represented were created from logbook records and matched to prices from fish slips submitted to DFO by participants of BC’s commercial fishing fleets. The dataset is comprised of an aggregate of all species over 10, 9, or 5 years of fishing seasons, depending on the fishery. To preserve potentially proprietary information, a privacy filtering Rule of Five has been applied to each planning unit (each 1km x 1km planning unit). If any planning units do not meet this minimum of 5 unique vessels/unique identifiers during the time span then they are flagged as being filtered and an average of all filtered planning units is applied. The accompanying GeoDB contains two data layers, “all_fisheries_filtered_gridded “, which includes all of the commercial fisheries data in 1km x 1km grids, and “DFO_marine_bioregions_NSB_subregions”, which includes polygon feature boundaries for the federal marine bioregions and Northern Shelf bioregion sub-regions. This dataset contains data for the following fisheries: - Bottom trawl (2012-2016) - Midwater trawl (2012-2016) - Shrimp by trawl (2007-2016) - Prawn trap (2007-2016) - Rockfish (2012-2016) - Sablefish (2007-2016) - Halibut (2007-2016) - Combo trips - halibut/sablefish (2007-2016) - Lingcod (2007-2016) - Green sea urchin (2006-2015) - Red sea urchin (2007-2015) - Sea cucumber (2008-2016) - Geoduck (2007-2015)
-

The water level data comes from the groundwater monitoring network of Nova Scotia (Canadian province). Each well in the observation network is equipped with a hydrostatic pressure transducer and a temperature sensor connected to a data logger. A second pressure transducer located above the water surface allows for adjusting the water level according to atmospheric pressure variations. The time series refers to the level below which the soil is saturated with water at the site and at the time indicated. The water level is expressed in meters above sea level (MASL). The dataset consists of a general description of the observation site including; the identifier, the name, the location, the elevation and a series of numerical values designating the water levels at a defined date and time of measurement.
-
Hunting districts as presented in the Compendium of Migratory Bird Hunting Regulations: Quebec https://www.canada.ca/fr/environnement-changement-climatique/services/chasse-oiseaux-migrateurs-gibier/reglementation-resumes-provinciaux-territoriaux/quebec.html These boundaries are presented for information purposes only and have no legal value.
-

The Atlantic dataset is part of Environment and Climate Change Canada’s Shoreline Classification and Pre-Spill database. Shoreline classification data has been developed for use by the Environmental Emergencies Program of Environment and Climate Change Canada for environmental protection purposes. Marine and estuarine shorelines are classified according to the character (substrate and form) of the upper intertidal (foreshore) or upper swash zone (Sergy, 2008). This is the area where oil from a spill usually becomes stranded and where treatment or cleanup activities take place. The basic parameter that defines the shoreline type is the material that is present in the intertidal zone. The presence or absence of sediments is a key factor in determining whether oil is stranded on the surface of a substrate or can penetrate and/or be buried. This dataset contains thousands of linear shoreline segments ranging in length from 200 m and 2 km long. The entities represent the location of the segments and their geomorphological description. There exist further fields in the attribute table for this dataset. We are currently working on standardizing our shoreline segmentation datasets and the updated data will soon be uploaded to the catalog. Sergy, G. (2008). The Shoreline Classification Scheme for SCAT and Oil Spill Response in Canada. Proceedings of the 31stArctic and Marine Oil Spill Program Technical Seminar.Environment Canada, Ottawa, ON, Pp. 811-819.
-

As part of a scientific assessment of critical habitat for boreal woodland caribou (Environment Canada 2011, see full reference in accompanying documentation), Environment Canada's Landscape Science and Technology Division was tasked with providing detailed anthropogenic disturbance mapping, across known caribou ranges, as of 2015. This data comprises a 5-year update to the mapping of 2008-2010 disturbances, and allows researchers to better understand the attributes that have a known effect on caribou population persistence. The original disturbance mapping was based on 30-metre resolution Landsat-5 imagery from 2008 -2010. The mapping process used in 2010 was repeated using 2015 Landsat imagery to create a nationally consistent, reliable and repeatable geospatial dataset that followed a common methodology. The methods developed were focused on mapping disturbances at a specific point of time, and were not designed to identify the age of disturbances, which can be of particular interest for disturbances that can be considered non-permanent, for example cutblocks. The resultant datasets were used for a caribou resource selection function (habitat modeling) and to assess overall disturbance levels on each caribou ranges. Anthropogenic disturbances within 51 caribou ranges across Canada were mapped. The ranges were defined by individual provinces and territories across Canada. Disturbances were remapped across these ranges using 2015 Landsat-8 satellite imagery to provide the most up-to-date data possible. As with the 2010 mapping project, anthropogenic disturbance was defined as any human-caused disturbance to the natural landscape that could be visually identified from Landsat imagery with 30-metre multi-band imagery at a viewing scale of 1:50,000. A minimum mapping unit MMU of 2 ha (approximately 22 contiguous 30-metre pixels) was selected. Each disturbance feature type was represented in the database by a line or polygon depending on their geometric description. Polygonal disturbances included: cutblocks, mines, reservoirs, built-up areas, well sites, agriculture, oil and gas facilities, as well as unknown features. Linear disturbances included: roads, railways, powerlines, seismic exploration lines, pipelines, dams, air strips, as well as unknown features. For each type of anthropogenic disturbance, a clear description was established (see Appendix 7.2 of the science assessment) to maintain consistency in identifying the various disturbances in the imagery by the different interpreters. Features were only digitized if they were visible in the Landsat imagery at the prescribed viewing scale. A 2nd interpreter quality-control phase was carried out to ensure high quality, complete and consistent data collection. For this 2015 update an additional, separate higher-resolution database was created by repeating the process using 15-metre panchromatic imagery. For the 30-metre database only, the line and poly data were buffered by a 500-metre radius, representing their extended zone of impact upon boreal caribou herds. Additionally, forest fire polygons were merged into the anthropogenic footprint in order to create an overall disturbance footprint. These buffered datasets were used in the calculation of range disturbance levels and for integrated risk assessment analysis.
-

This data is intended to identify Canadian fresh waters which require additional measures (e.g., ballast water exchange and treatment) prior to release, as described in https://tc.canada.ca/en/marine-transportation/marine-safety/list-canada-s-designated-alternate-ballast-water-exchange-area-fresh-waters-tp-13617e-2021. The data is not intended for navigation purposes. According to Canada’s Ballast Water Regulations, vessels which are managing ballast water to meet the ballast water performance standard cannot release ballast water into fresh waters unless that ballast water was first exchanged in accordance with the ballast water exchange standard. For the purpose of this requirement, Canadian fresh waters are the following: - the waters at the Port of Kitimat and waters in or upstream of the Kitimat Arm, east of a line between Hilton Point and Steel Point; - the waters at the Port of Stewart and waters in or upstream of the Portland Canal, north of a line between Portland Point and Ramsden Point; - the waters of all Fraser River ports that are: -- east of Tilbury Island in the main arm of the Fraser River including Annacis Island and New Westminster docking areas; and -- east of the eastern tip of Mitchell Island in the north arm of Fraser River; - the waters of the Saguenay River ports and waters upstream of L’Anse-Creuse; - the waters of all St. Lawrence River ports and waters west of the east point of Ile d’Orléans including the port of Quebec City; - all Canadian waters of the Great Lakes Basin; and - the waters of Happy Valley-Goose Bay and waters of Lake Melville west of Rabbit Island. Legal Constraints: Users should be aware that the polygons depicting areas requiring additional measures to manage ballast water are intended for illustration only and should not be used for navigational or legal purposes.
-
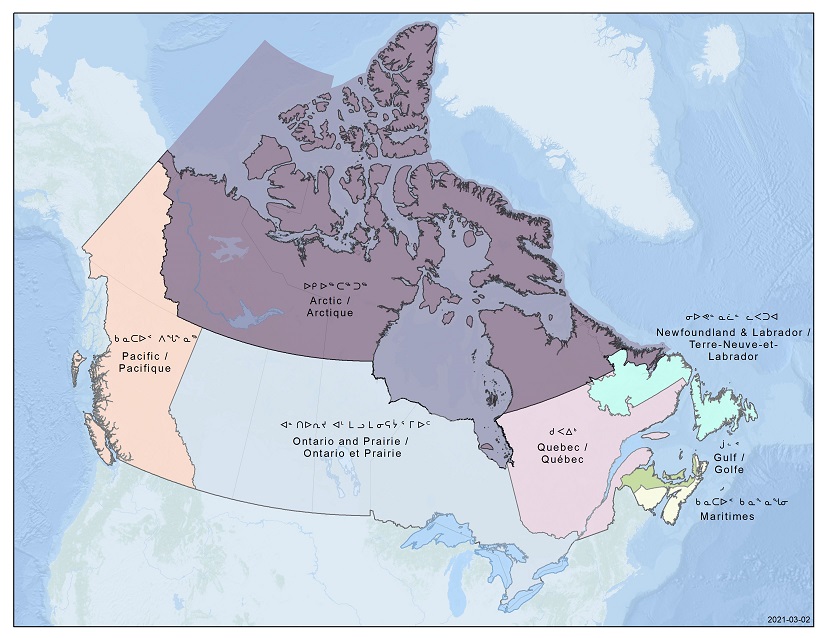
In 2021, the Canada Coast Guard (CCG) and Fisheries and Oceans Canada (DFO) updated its administrative boundaries following the creation a new Arctic region.There are now 7 administrative regions in DFO (Pacific, Arctic, Ontario and Prairie, Quebec, Gulf, Maritimes, Newfoundland and Labrador). DFO and Coast Guard Arctic Regions developed these regions in partnership with the people they serve; this important decision will lead to stronger programs and services to better meet the unique needs of our Arctic communities.DFO and CCG operations and research cover Canada's land and waters to the international boundaries (EEZ) and are in no way limited to the boundaries drawn in the map.
-

GIS compilation of data used to perform the stacked cumulative chance of success (resource potential map) in Open file 8556. Natural Resources Canada (NRCan) has been tasked, under the Marine Conservation Targets (MCT) initiative announced in Budget 2016, with evaluating the petroleum resource potential for areas identified for possible protection as part of the Government of Canada's commitment to conserve 10% of its marine areas by 2020. As part of this initiative, NRCan's Geological Survey of Canada (GSC) conducted a broad regional study of the petroleum potential over the majority of the Magdalen Basin, which is the principal geological basin in the southern Gulf of St. Lawrence. The GSC resource assessment is visually represented by a qualitative petroleum potential map. Disclaimer: A simplified colored version of the map is displayed on the Web Mapping Service (WMS). The correct version is available for download through the Federal Geospatial Platform (FGP) and GEOSCAN.
-

Dataset of species/gear type commercial fisheries from 2012 to 2021 in the Eastern Canada Regions. Only fish harvested from the NL, Maritimes, Gulf, Quebec and Eastern Arctic regions are included (Species Sought). The data was obtained from Statistical Services, Fisheries and Oceans Canada (DFO) and consists of commercial species/gear type landings data from 2012 to 2021 taken from Northwest Atlantic Fisheries Organization (NAFO) Subareas 0, 2, 3, 4 and 5 and fished in the NL, Maritimes, Gulf, Quebec and Eastern Arctic regions. The layer was created by overlaying a 2 minute hexagonal grid (approx. 10km2 cell) on species/gear type commercial fisheries point data and summing the total landings by weight reported for each cell over the ten year period. Therefore, the value of each grid cell is equal to the total species/gear type landings in kg from 2012 to 2021 for the area, and may represent many fishing events from several vessels over the ten year period. All landings are from Canadian vessels greater than 35-ft, and does not include information pertaining to international fishing vessels (i.e., St. Pierre). Individuals should exercise caution when interpreting this data. Data has not been altered and is mapped from the original logbook entry for each record prior to amalgamation. Data may contain errors such as inaccurate or nonviable coordinates, landed weights and/or species identification. For example, cases of fishing events reported in a NAFO Division with corresponding coordinates falling outside that particular NAFO Division or fishing events which appear to be located on a land mass due to rounding errors in the original entries. Such cases were excluded from the dataset. Only one location is given for each fishing event; therefore, a fishing activity that would normally cover a large area (i.e., trawling) is only shown in a single location. Some species may not include all records or locations where activity is taking place due to regional differences in permissions for mapping, or because the fishery is only partially georeferenced (e.g. Lobster). The locations/areas shown should only be used as an estimation of fishing intensity and a general guide of where particular species/gear type fishing occurs. This dataset has been privacy screened to comply with the Government of Canada's privacy policy. Privacy assessments were conducted to identify NAFO unit areas containing data with less than five vessel IDs, license IDs and fisher IDs. If this threshold was not met, catch weight locations have been withheld from these statistical areas to protect the identity or activity of individual vessels or companies. In some instances, permissions were obtained to map species or gears with a limited number of vessels, licenses, or fisher ids. The withheld areas are indicated by the unit area that has been removed and given a weight of -9999.