 Arctic SDI catalogue
External Authoritative
Type of resources
Available actions
Topics
Keywords
Contact for the resource
Provided by
Years
Formats
Service types
Scale
Resolution
-

This metadata covers the Water Cover Duration (WCD) product which is one of the products of the pan-European High-Resolution Water Snow & Ice portfolio (HR-WSI), which are provided at high spatial resolution from the Sentinel-2 and Sentinel-1 constellations data from September 1, 2016 onwards. The High Resolution Water Layer portfolio consists of the Water Layer (WL), the Water Presence Index (WPI), the Water confidence layer (WCL) and the Rolling archive (WLRA). The WCD is generated on a yearly basis, starting in 2017 (01.09 to 30.08 each year), and is published in October. It provides an estimated number of days during which the area was covered by water for each pixel within the entire EEA-38+UK region. The product is derived from data obtained from the Sentinel-1 and Sentinel-2 satellites, as well as from the Sentinel-2 Water and Ice Cover (WIC S2) product. The product has a spatial resolution of 10m x 10m and 100 m x 100 m, is delivered in LAEA and WGS84/UTM projection and is updated on an annual basis. This methodology results in a high-quality WCD information layer. The WCD product represents one of the two water products within the overall WSI product portfolio, which includes not only water but also snow and ice data.
-

EU-Hydro is a dataset for all EEA38 countries and United Kingdom providing photo-interpreted river network, consistent of surface interpretation of water bodies (lakes and wide rivers), and a drainage model (also called Drainage Network), derived from EU-DEM, with catchments and drainage lines and nodes. This metadata refers to the EU-Hydro coastline, which is disseminated as one shapefile merged for all 35 basins. The coastline is also included for each basin in the EU-Hydro River Network Database. The production of EU-Hydro and the derived layers was coordinated by the European Environment Agency in the frame of the EU Copernicus programme.
-

This metadata covers the Ice Cover Duration (ICD) product. It is generated once a year and it provides an estimated number of ice covered days for each pixel in the inland waters at European scale. The product is derived from Water/Ice Cover (WIC) products, both from Sentinel-1 and Sentinel-2 observations. It has a spatial resolution of 100 m x 100 m. It is also available in another projection as tiles aligned with Sentinel-2 (UTM/WGS84) at 20 m x 20 m. ICD is one of the products of the pan-European High-Resolution Water Snow & Ice portfolio (HR-WSI), which are provided at high spatial resolution from the Sentinel-2 and Sentinel-1 constellations data from September 1, 2016 onwards.
-
Water body silicate - Monthly Climatology for the European Seas for the period 1960-2020 on the domain from longitude -45.0 to 70.0 degrees East and latitude 24.0 to 83.0 degrees North. Data Sources: observational data from SeaDataNet/EMODnet Chemistry Data Network. Description of DIVA analysis: The computation was done with the DIVAnd (Data-Interpolating Variational Analysis in n dimensions), version 2.7.2, using GEBCO 30sec topography for the spatial connectivity of water masses. Horizontal correlation length and vertical correlation length vary spatially depending on the topography and domain. Depth range: 0.0, 5.0, 10.0, 15.0, 20.0, 25.0, 30.0, 35.0, 40.0, 45.0, 50.0, 55.0, 60.0, 65.0, 70.0, 75.0, 80.0, 85.0, 90.0, 95.0, 100.0, 125.0, 150.0, 175.0, 200.0, 225.0, 250.0, 275.0, 300.0, 325.0, 350.0, 375.0, 400.0, 425.0, 450.0, 475.0, 500.0, 550.0, 600.0, 650.0, 700.0, 750.0, 800.0, 850.0, 900.0, 950.0, 1000.0, 1050.0, 1100.0, 1150.0, 1200.0, 1250.0, 1300.0, 1350.0, 1400.0, 1450.0, 1500.0, 1550.0, 1600.0, 1650.0, 1700.0, 1750.0, 1800.0, 1850.0, 1900.0, 1950.0, 2000.0, 2100.0, 2200.0, 2300.0, 2400.0, 2500.0, 2600.0, 2700.0, 2800.0, 2900.0, 3000.0, 3100.0, 3200.0, 3300.0, 3400.0, 3500.0, 3600.0, 3700.0, 3800.0, 3900.0, 4000.0, 4100.0, 4200.0, 4300.0, 4400.0, 4500.0, 4600.0, 4700.0, 4800.0, 4900.0, 5000.0, 5100.0, 5200.0, 5300.0, 5400.0, 5500.0 m. Units: umol/l. The horizontal resolution of the produced DIVAnd analysis is 0.25 degrees.
-

This metadata covers the Ice Cover Duration (ICD) product is generated once a year and it provides an estimated number of ice covered days for each pixel in the inland waters at European scale. The product is derived from Water/Ice Cover (WIC) products, both from Sentinel-1 and Sentinel-2 observations. It has a spatial resolution of 20 m x 20 m. It is also available in another projection as tiles aligned with the Pan-European High-Resolution Layers in the European 20 m x 20 m grid (ETRS89 LAEA - EPSG: 3035). ICD is one of the products of the pan-European High-Resolution Water Snow & Ice portfolio (HR-WSI), which are provided at high spatial resolution from the Sentinel-2 and Sentinel-1 constellations data from September 1, 2016 onwards.
-

The "EMODnet Digital Bathymetry (DTM)- 2022" is a multilayer bathymetric product for Europe’s sea basins covering: • the Greater North Sea, including the Kattegat and stretches of water such as Fair Isle, Cromarty, Forth, Forties,Dover, Wight, and Portland • the English Channel and Celtic Seas • Western Mediterranean, the Ionian Sea and the Central Mediterranean Sea • Iberian Coast and Bay of Biscay (Atlantic Ocean) • Adriatic Sea (Mediterranean) • Aegean - Levantine Sea (Mediterranean). • Madeira and Azores (Macaronesia) • Baltic Sea • Black Sea • Norwegian and Icelandic Seas • Canary Islands (Macaronesia) • Arctic region and Barentz Sea The DTM is based upon 21937 bathymetric survey data sets and Composite DTMs that have been gathered from 64 data providers from 28 countries riparian to European seas and beyond. Also Satellite Derived Bathymetry data products have been included fro Landsat 8 and Sentinel satellite images. Areas not covered by observations are completed by integrating GEBCO 2022 and IBCAO V4. The source reference layer in the portal viewing service gives metadata of the data sets used with their data providers; the metadata also acknowledges the data originators. The incorporated survey data sets itself can be discovered and requested for access through the Common Data Index (CDI) data discovery and access service that in December 2022 contained > 41.000survey data sets from European data providers for global waters. The Composite DTMs can be discovered through the Sextant Catalogue service. Both discovery services make use of SeaDataNet standards and services and have been integrated in the EMODnet portal (https://emodnet.ec.europa.eu/en/bathymetry#bathymetry-services ). In addition, the EMODnet Map Viewer (https://emodnet.ec.europa.eu/geoviewer/ ) gives users wide functionality for viewing and downloading the EMODnet digital bathymetry such as: • water depth (refering to the Lowest Astronomical Tide Datum - LAT) in gridded form on a DTM grid of 1/16 * 1/16 arc minute of longitude and latitude (ca 115 * 115 meters). • option to view depth parameters of individual DTM cells and references to source data • option to download DTM in 58 tiles in different formats: ESRI ASCII, XYZ, EMODnet CSV, NetCDF (CF), GeoTiff and SD • option to visualize the DTM in 3D in the browser without plug-in • layer with a number of high resolution DTMs for coastal regions • layer with wrecks from the UKHO Wrecks database. The EMODnet DTM is also available by means of OGC web services (WMS, WFS, WCS, WMTS), which are specified at the EMODnet Bathymetry portal. The original datasets themselves are not distributed but described in the metadata services, giving clear information about the background survey data used for the DTM, their access restrictions, originators and distributors and facilitating requests by users to originator.
-

This is the metadata covering the Water Layer (WL) product. The WL is one of the products of the pan-European High-Resolution Water Snow & Ice portfolio (HR-WSI), which are provided at high spatial resolution from the Sentinel-2 and Sentinel-1 constellations data from September 1, 2016 onwards.. The WL is generated for the 2021 reference year. It is a a multi-annual product based on the information covering the period 2016-2021. In the context of the HR-WSI, the water and dry frequency masks are derived from intermediate outputs of the WCD workflow, the monthly surface water masks in combination with the WIC S2 NRT product. It provides detailed information about the presence and condition of water surfaces across Europe. It is also generated in different spatial resolutions (10m and 100m) and projections (LAEA & WGS84/UTM). The High Resolution Water Layer portfolio consists of the WL, the Water Presence Index (WPI), the Water confidence layer (WCL) and the Rolling archive (WLRA). There are 5 major classes like: - Dry (always or mostly dry with minor instances of wet) - permanent water (always contains water) - temporary water ( temporary water surfaces, aliteration of dry and water) - sea water (oceans and sea) - clouds
-
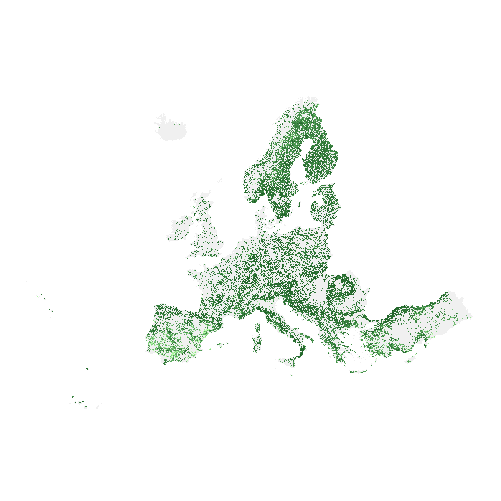
The high resolution forest product consists of three types of (status) products and additional change products. The status products are available for the 2012, 2015 and 2018 reference years: 1. Tree cover density providing level of tree cover density in a range from 0-100%; 2. Dominant leaf type providing information on the dominant leaf type: broadleaved or coniferous; 3. A Forest type product. The forest type product allows to get as close as possible to the FAO forest definition. In its original (20m) resolution it consists of two products: 1) a dominant leaf type product that has a MMU of 0.5 ha, as well as a 10% tree cover density threshold applied, and 2) a support layer that maps, based on the dominant leaf type product, trees under agricultural use and in urban context (derived from CLC and high resolution imperviousness 2009 data). For the final 100m product trees under agricultural use and urban context from the support layer are removed. The high resolution forest change products comprise a simple tree cover density change product for 2012-2015 (% increase or decrease of real tree cover density changes). The production of the high resolution forest layers was coordinated by the European Environment Agency (EEA) in the frame of the EU Copernicus programme.
-
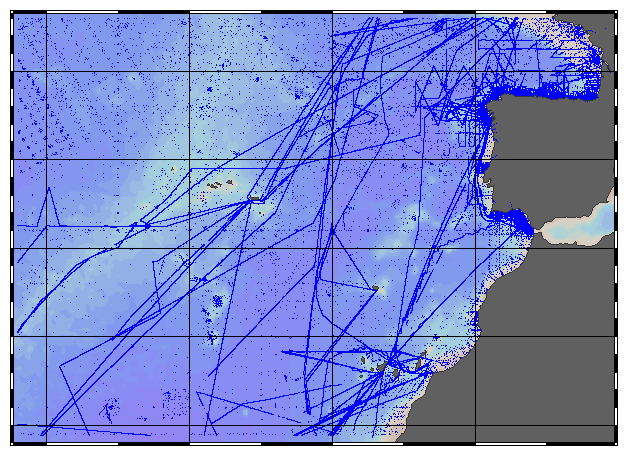
EMODnet Chemistry aims to provide access to marine chemistry data sets and derived data products concerning eutrophication, acidity and contaminants. The chemicals chosen reflect importance to the Marine Strategy Framework Directive (MSFD). ITS-90 water temperature and Water body salinity variables have been also included (as-is) to complete the Eutrophication and Acidity data. If you use these variables for calculations, please refer to SeaDataNet for having the quality flags: https://www.seadatanet.org/Products/Aggregated-datasets. This aggregated dataset contains all unrestricted EMODnet Chemistry data on Eutrophication and Acidity (18 parameters with quality flag indicators), and covers the Northeast Atlantic Ocean (40W) with 381639 CDI records (381085 Vertical profiles and 554 Time series). Vertical profiles temporal range is from 1921-10-15 to 2020-10-16. Time series temporal range is from 1974-06-14 to 2019-04-24. Data were aggregated and quality controlled by 'IFREMER / IDM / SISMER - Scientific Information Systems for the SEA' from France. Regional datasets concerning eutrophication and acidity are automatically harvested and resulting collections are aggregated and quality controlled using ODV Software and following a common methodology for all Sea Regions ( https://doi.org/10.6092/9f75ad8a-ca32-4a72-bf69-167119b2cc12). When not present in original data, Water body nitrate plus nitrite was calculated by summing up the Nitrates and Nitrites. Same procedure was applied for Water body dissolved inorganic nitrogen (DIN) which was calculated by summing up the Nitrates, Nitrites and Ammonium. Parameter names are based on P35, EMODnet Chemistry aggregated parameter names vocabulary, which is available at: https://www.bodc.ac.uk/resources/vocabularies/vocabulary_search/P35/. Detailed documentation is available at: https://dx.doi.org/10.6092/4e85717a-a2c9-454d-ba0d-30b89f742713 Explore and extract data at: https://emodnet-chemistry.webodv.awi.de/eutrophication%3EAtlantic The aggregated dataset can also be downloaded as ODV collection and spreadsheet, which is composed of metadata header followed by tab separated values. This spreadsheet can be imported to ODV Software for visualisation (More information can be found at: https://www.seadatanet.org/Software/ODV ). The original datasets can be searched and downloaded from EMODnet Chemistry Chemistry CDI Data and Discovery Access Service: https://emodnet-chemistry.maris.nl/search
-
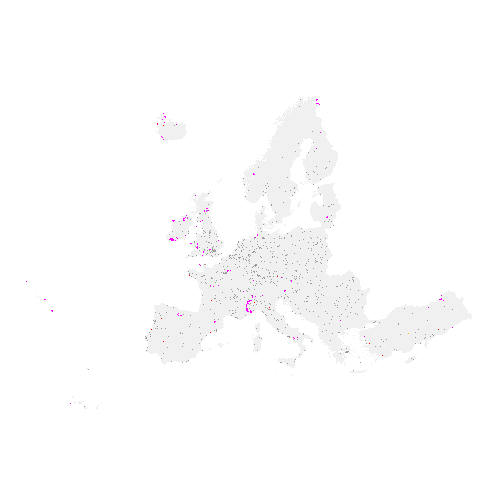
The high resolution imperviousness products capture the percentage and change of soil sealing. Built-up areas are characterized by the substitution of the original (semi-) natural land cover or water surface with an artificial, often impervious cover. These artificial surfaces are usually maintained over long periods of time. A series of high resolution imperviousness datasets (for the 2006, 2009, 2012 and 2015 reference years) with all artificially sealed areas was produced using automatic derivation based on calibrated Normalized Difference Vegetation Index (NDVI). This series of imperviousness layers constitutes the main status layers. They are per-pixel estimates of impermeable cover of soil (soil sealing) and are mapped as the degree of imperviousness (0-100%). Imperviousness change layers were produced as a difference between the reference years (2006-2009, 2009-2012, 2012-2015 and additionally 2006-2012, to fully match the CORINE Land Cover production cycle) and are presented 1) as degree of imperviousness change (-100% -- +100%), in 20m and 100m pixel size, and 2) a classified (categorical) 20m change product.