 Arctic SDI catalogue
FGDB/GDB
Type of resources
Available actions
Topics
Keywords
Contact for the resource
Provided by
Formats
Representation types
Update frequencies
status
Scale
Resolution
-

The Quebec—Saint-Lawrence River dataset is part of Environment and Climate Change Canada’s Shoreline Classification and Pre-Spill database. Shoreline classification data has been developed for use by the Environmental Emergencies Program of Environment and Climate Change Canada for environmental protection purposes. Marine and freshwater shorelines are classified according to the character (substrate and form) of the upper intertidal (foreshore) or upper swash zone (Sergy, 2008). This is the area where oil from a spill usually becomes stranded and where the treatment or cleanup activities take place. The basic parameter that defines the shoreline type is the material that is present in the intertidal zone. The presence or absence of sediments is a key factor in determining whether oil is stranded on the surface of a substrate or can penetrate and/or be buried. This dataset contains thousands of linear shoreline segments ranging in length from 200 m and 2 km long. The entities represent the location of the segments and their geomorphological description. There exist further fields in the attribute table for this dataset. We are currently working on standardizing our shoreline segmentation datasets and the updated data will soon be uploaded to the catalog. Sergy, G. (2008). The Shoreline Classification Scheme for SCAT and Oil Spill Response in Canada. Proceedings of the 31stArctic and Marine Oil Spill Program Technical Seminar.Environment Canada, Ottawa, ON, Pp. 811-819.
-
Hunting districts as presented in the Compendium of Migratory Bird Hunting Regulations: Quebec https://www.canada.ca/fr/environnement-changement-climatique/services/chasse-oiseaux-migrateurs-gibier/reglementation-resumes-provinciaux-territoriaux/quebec.html These boundaries are presented for information purposes only and have no legal value.
-

Dataset of species/gear type commercial fisheries from 2014 to 2023 in the Eastern Canada Regions. Only fish harvested from the NL, Maritimes, Gulf, Quebec and Eastern Arctic regions are included (Species Sought). The data was obtained from Statistical Services, Fisheries and Oceans Canada (DFO) and consists of commercial species/gear type landings data from 2014 to 2023 taken from Northwest Atlantic Fisheries Organization (NAFO) Subareas 0, 2, 3, 4 and 5 and fished in the NL, Maritimes, Gulf, Quebec and Eastern Arctic regions. The layer was created by overlaying a 2 minute hexagonal grid (approx. 10km2 cell) on species/gear type commercial fisheries point data and summing the total landings by weight reported for each cell over the ten year period. Therefore, the value of each grid cell is equal to the total species/gear type landings in kg from 2014 to 2023 for the area, and may represent many fishing events from several vessels over the ten year period. All landings are from Canadian vessels and does not include information pertaining to international fishing vessels (i.e., St. Pierre). Individuals should exercise caution when interpreting this data. Data has not been altered and is mapped from the original logbook entry for each record prior to amalgamation. Data may contain errors such as inaccurate or nonviable coordinates, landed weights and/or species identification. For example, cases of fishing events reported in a NAFO Division with corresponding coordinates falling outside that particular NAFO Division or fishing events which appear to be located on a land mass due to rounding errors in the original entries. Such cases were excluded from the dataset. Only one location is given for each fishing event; therefore, a fishing activity that would normally cover a large area (i.e., trawling) is only shown in a single location. Some species may not include all records or locations where activity is taking place due to regional differences in permissions for mapping, or because the fishery is only partially georeferenced (e.g. Lobster). The locations/areas shown should only be used as an estimation of fishing intensity and a general guide of where particular species/gear type fishing occurs. This dataset has been privacy screened to comply with the Government of Canada's privacy policy. Privacy assessments were conducted to identify NAFO unit areas containing data with less than five vessel IDs, license IDs and fisher IDs. If this threshold was not met, catch weight locations have been withheld from these statistical areas to protect the identity or activity of individual vessels or companies. In some instances, permissions were obtained to map species or gears with a limited number of vessels, licenses, or fisher ids. The withheld areas are indicated by the unit area that has been removed and given a weight of -9999.
-

The water level data comes from the groundwater monitoring network of Saskatchewan (Canadian province). Each well in the observation network is equipped with a hydrostatic pressure transducer and a temperature sensor connected to a data logger. A second pressure transducer located above the water surface allows for adjusting the water level according to atmospheric pressure variations. The time series refers to the level below which the soil is saturated with water at the site and at the time indicated. The water level is expressed in meters above sea level (MASL). The dataset consists of a general description of the observation site including; the identifier, the name, the location, the elevation and a series of numerical values designating the water levels at a defined date and time of measurement.
-
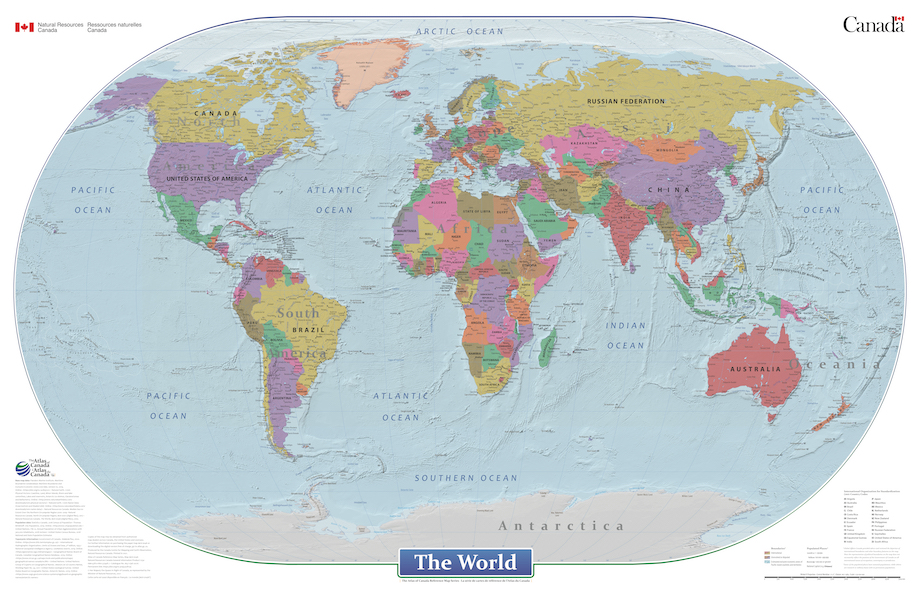
This cartographic digital product is derived from the Atlas of Canada's wall map "The World" (MCR 0046) and "Le monde" (MCR 0046F) published in 2021. The World is a general reference political map focused on the names and international boundaries of sovereign and non-sovereign countries. The information is portrayed using the Winkel II projection at a scale of 1:29 000 000. The dataset includes international boundaries, populated places, and labelled major hydrographic and physical features. In the geodatabase the representation of political boundaries do not necessarily reflect the position of the Government of Canada on all international issues of recognition, sovereignty or jurisdiction; some of the populated places have seasonal populations, while others are research or military bases with no permanent populations; and, there are no attribute information in the geodatabase for the labelled hydrographic and physical features.
-

The water level data comes from the groundwater monitoring network of Yukon (Canadian territory). Each well in the observation network is equipped with a hydrostatic pressure transducer and a temperature sensor connected to a data logger. A second pressure transducer located above the water surface allows for adjusting the water level according to atmospheric pressure variations. The time series refers to the level below which the soil is saturated with water at the site and at the time indicated. The water level is expressed in meters above sea level (MASL). The dataset consists of a general description of the observation site including; the identifier, the name, the location, the elevation and a series of numerical values designating the water levels at a defined date and time of measurement.
-

The water level data comes from the groundwater monitoring network of Alberta (Canadian province). Each well in the observation network is equipped with a hydrostatic pressure transducer and a temperature sensor connected to a data logger. A second pressure transducer located above the water surface allows for adjusting the water level according to atmospheric pressure variations. The time series refers to the level below which the soil is saturated with water at the site and at the time indicated. The water level is expressed in meters above sea level (MASL). The dataset consists of a general description of the observation site including; the identifier, the name, the location, the elevation and a series of numerical values designating the water levels at a defined date and time of measurement.
-

Three marine spatial planning areas are delineated in Eastern Canada to define the spatial extents of marine spatial plans being led by Fisheries and Oceans Canada (DFO): the Estuary and Gulf of St. Lawrence (EGSL), the Newfoundland and Labrador (NL) Shelves, and the Scotian Shelf and Bay of Fundy. The EGSL planning area includes the St. Lawrence River estuary from northeast of Île d’Orléans, Quebec, the Saguenay River estuary, and the entire Gulf of St. Lawrence as far north as the Strait of Belle Isle (NAFO Divisions 4RST). The NL Shelves planning area includes areas off southern, eastern and northern Newfoundland, part of the Churchill River and Lake Melville, as well as off the Labrador coast to the extent of the exclusive economic zone (EEZ) (NAFO Divisions 2GHJ and 3KLNOP). The Scotian Shelf and Bay of Fundy planning area includes DFO Maritimes’ administrative region off the Atlantic coast of Nova Scotia to the extent of the EEZ, the Bay of Fundy and the Canadian portion of the Gulf of Maine (NAFO Divisions 4VWX, 5Ze, and the Canadian portion of 5Y). The French EEZ for St. Pierre et Miquelon is excluded from the three planning areas. These planning areas are derived from Federal Marine Bioregions (https://open.canada.ca/data/en/dataset/23eb8b56-dac8-4efc-be7c-b8fa11ba62e9) that were developed by a Canadian Science Advisory Secretariat process using ecosystem-based management principles to define 13 ecological bioregions that have informed but not directed DFO implementation of marine spatial planning.
-

These datasets show commercial fisheries catch weight landings of directed fisheries and bycatch from the Scotian Shelf, the Bay of Fundy, and Georges Bank from NAFO Divisions 4VWX and the Canadian portions of 5Y and 5Z. Atlantic Canadian inter-regional maps of four species (Atlantic Halibut, Bluefin Tuna, Redfish and Scallop) are also included from NAFO Divisions 4RST, 3KLMNOP, and 2GHJ. Five-year composite maps (2014–2018) that aggregate catches for each map series are publicly available. The maps aggregate catch weight (kg) per 10 km2 hexagon grid cell for selected species, species groupings and gear types to identify important fishing areas. These maps may be used for decision making in coastal and oceans management, including marine spatial planning, environmental emergency response operations and protocols, Marine Stewardship Council certification processes, marine protected area networks, and ecological risk assessment. These datasets have been filtered to comply with the Government of Canada's privacy policy. Privacy assessments were conducted to identify NAFO unit areas containing data with less than five vessel IDs, licence IDs or fisher IDs. If this threshold was not met, catch weight locations were withheld from these unit areas to protect the identity or activity of individual vessels or companies. Maps were created for the following species, species groupings and gear types: 1. Groundfish (all species) 2. Groundfish Bottom Trawl 3. Groundfish Gillnet 4. Groundfish Bottom Longline 5. Groundfish (quarterly composites Q1, Q2, Q3, Q4) 6. Atlantic Cod 7. Atlantic Cod, Haddock and Pollock 8. Flatfish 9. Atlantic Halibut 10. Greenland Halibut (Turbot) 11. Hagfish 12. Cusk 13. Dogfish 14. Redfish 15. Red Hake 16. Silver Hake 17. White Hake 18. Monkfish 19. Sculpin 20. Skate 21. Wolffish 22. Squid 23. Herring 24. Mackerel 25. Large Pelagics 26. Bluefin Tuna 27. Other Tuna 28. Swordfish 29. Porbeagle, Mako and Blue Shark 30. Snow Crab 31. Other Crab 32. Scallop 33. Scallop (quarterly composites Q1, Q2, Q3, Q4) 34. Offshore Clam 35. Shrimp 36. Offshore Lobster 37. Disputed Zone Area 38B Lobster 38. Whelk
-

The water level data comes from the groundwater monitoring network of Nova Scotia (Canadian province). Each well in the observation network is equipped with a hydrostatic pressure transducer and a temperature sensor connected to a data logger. A second pressure transducer located above the water surface allows for adjusting the water level according to atmospheric pressure variations. The time series refers to the level below which the soil is saturated with water at the site and at the time indicated. The water level is expressed in meters above sea level (MASL). The dataset consists of a general description of the observation site including; the identifier, the name, the location, the elevation and a series of numerical values designating the water levels at a defined date and time of measurement.