 Arctic SDI catalogue
Geoscience and history policy
Type of resources
Available actions
Topics
Keywords
Contact for the resource
Provided by
Formats
Representation types
Update frequencies
status
Scale
-
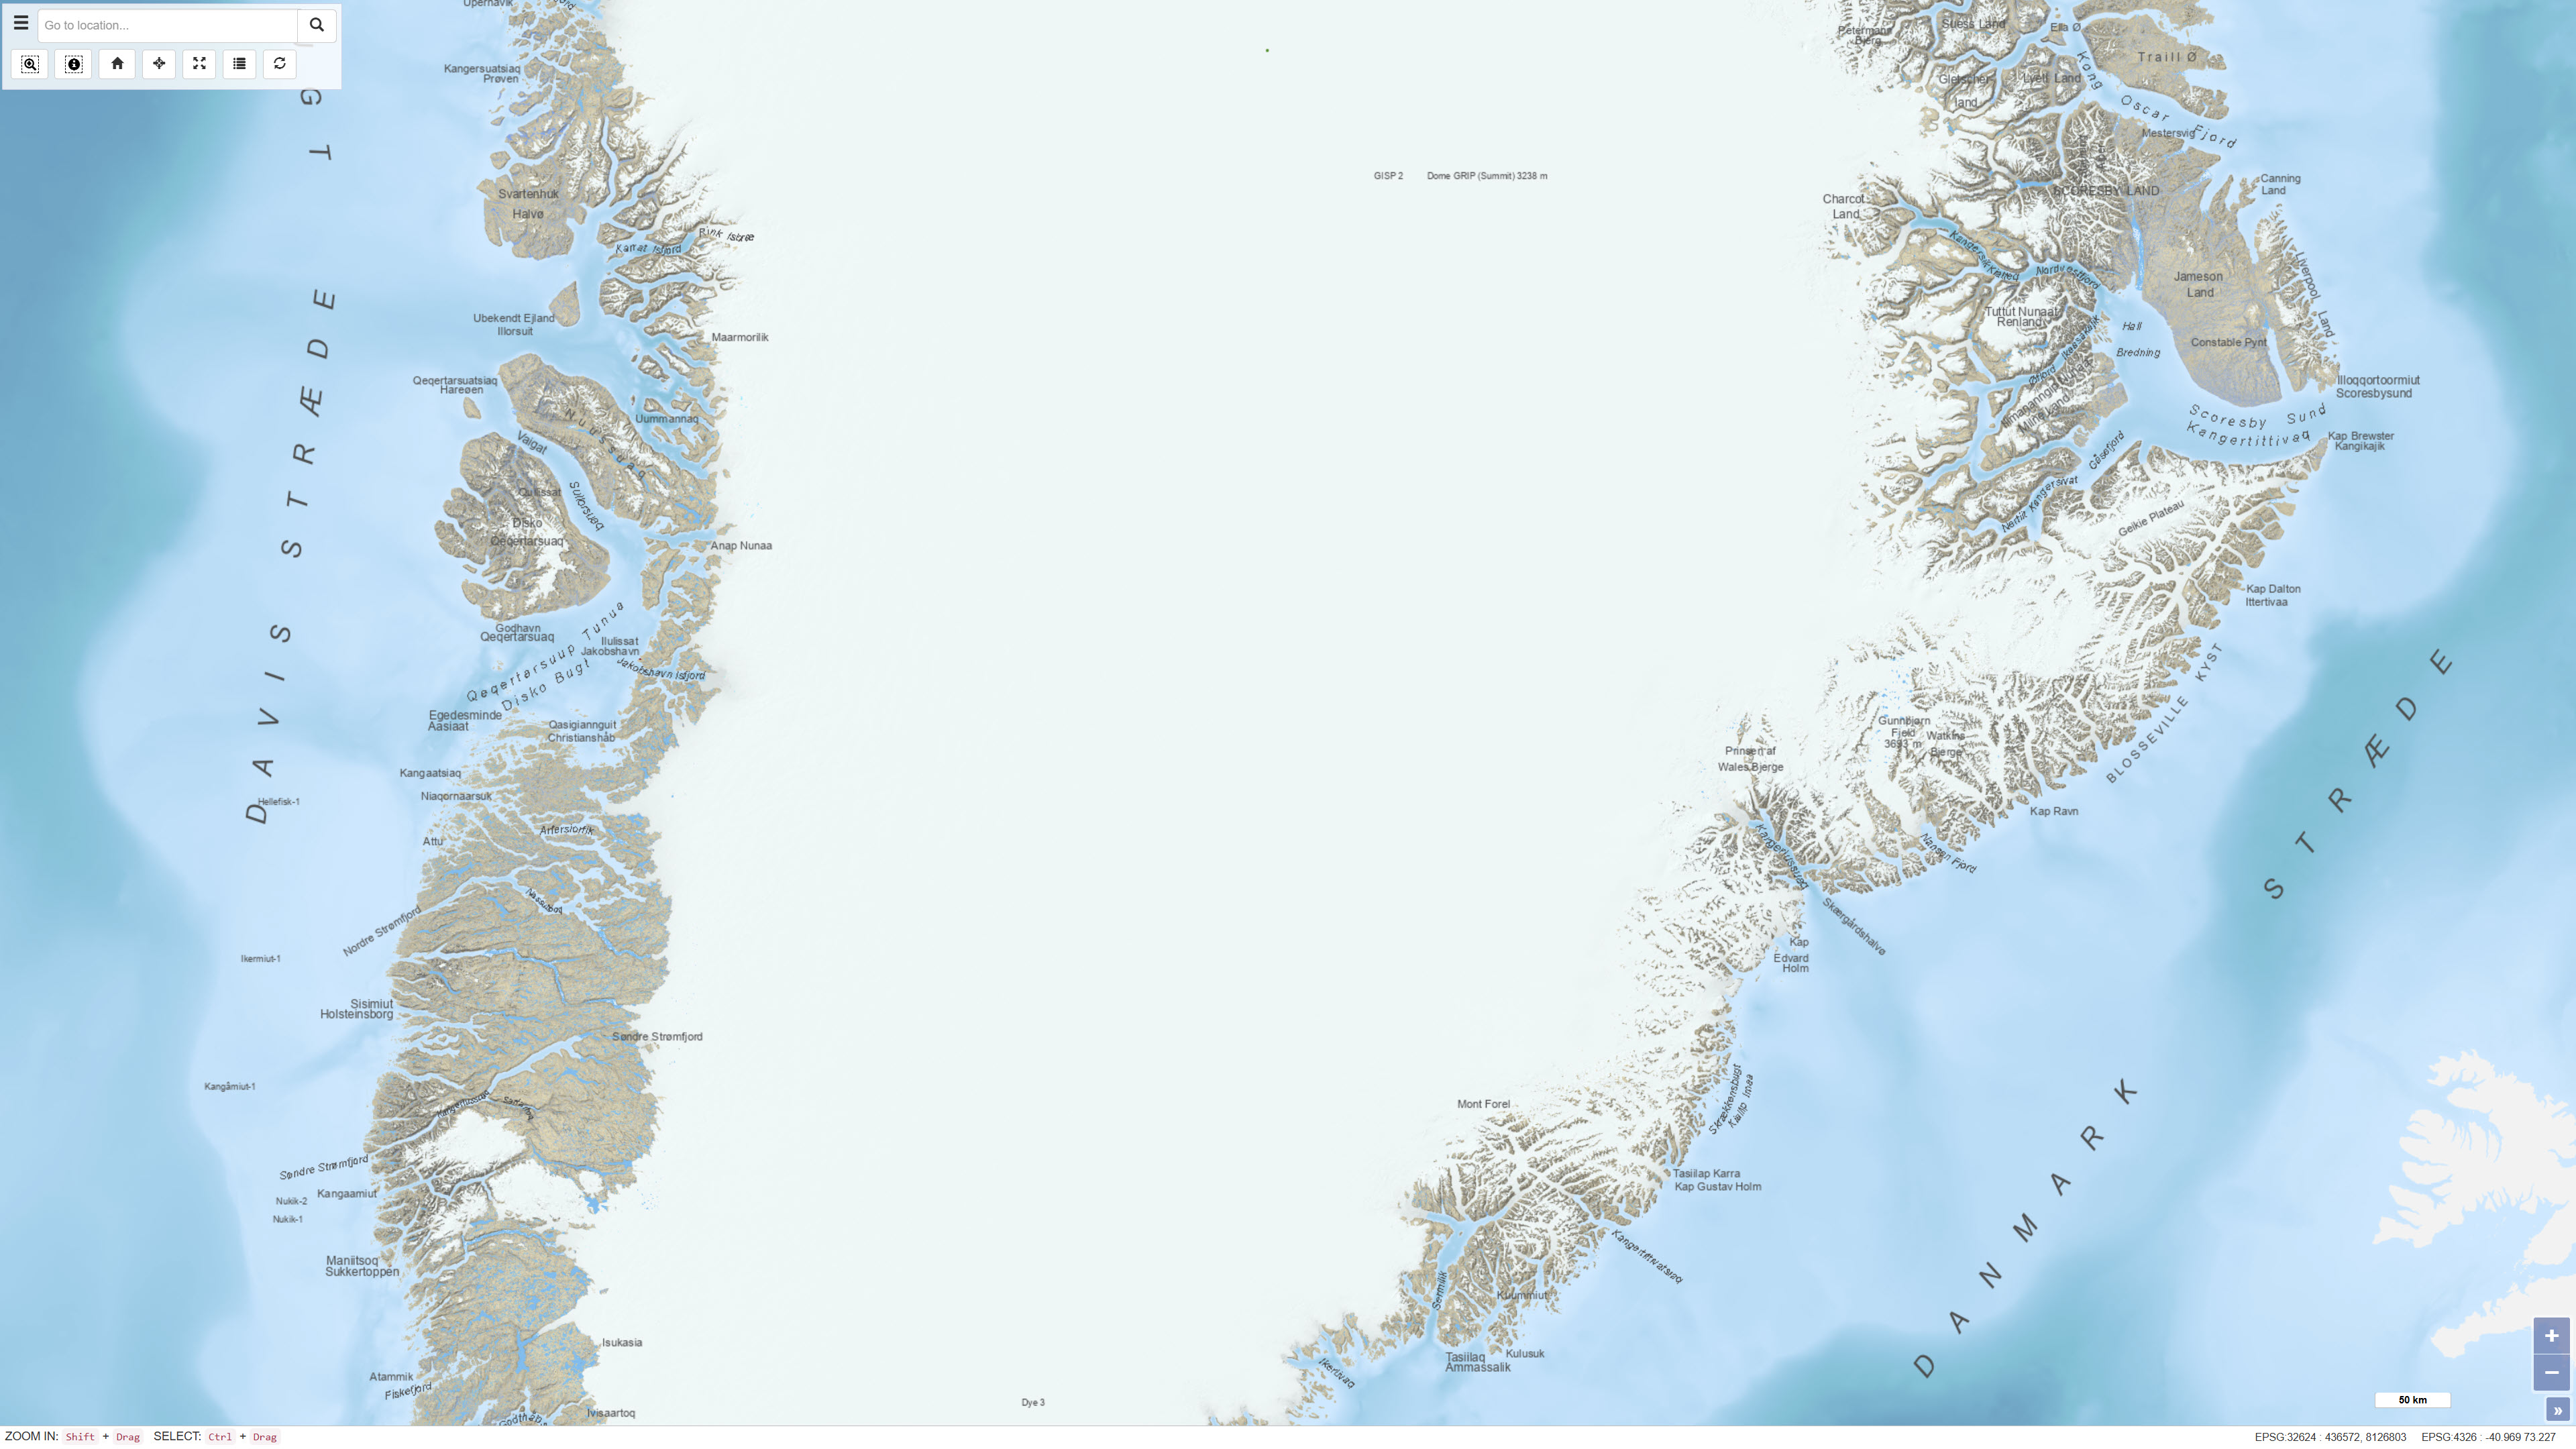
The dataset consists of three different datasets with combined place names in various geological maps: Geological map of Greenland 1:2.500.000, Geological maps of Greenland 1:500.000 and Topographic map of Greenland 1:250.000. The dataset has not been updated or maintained since 2014.
-
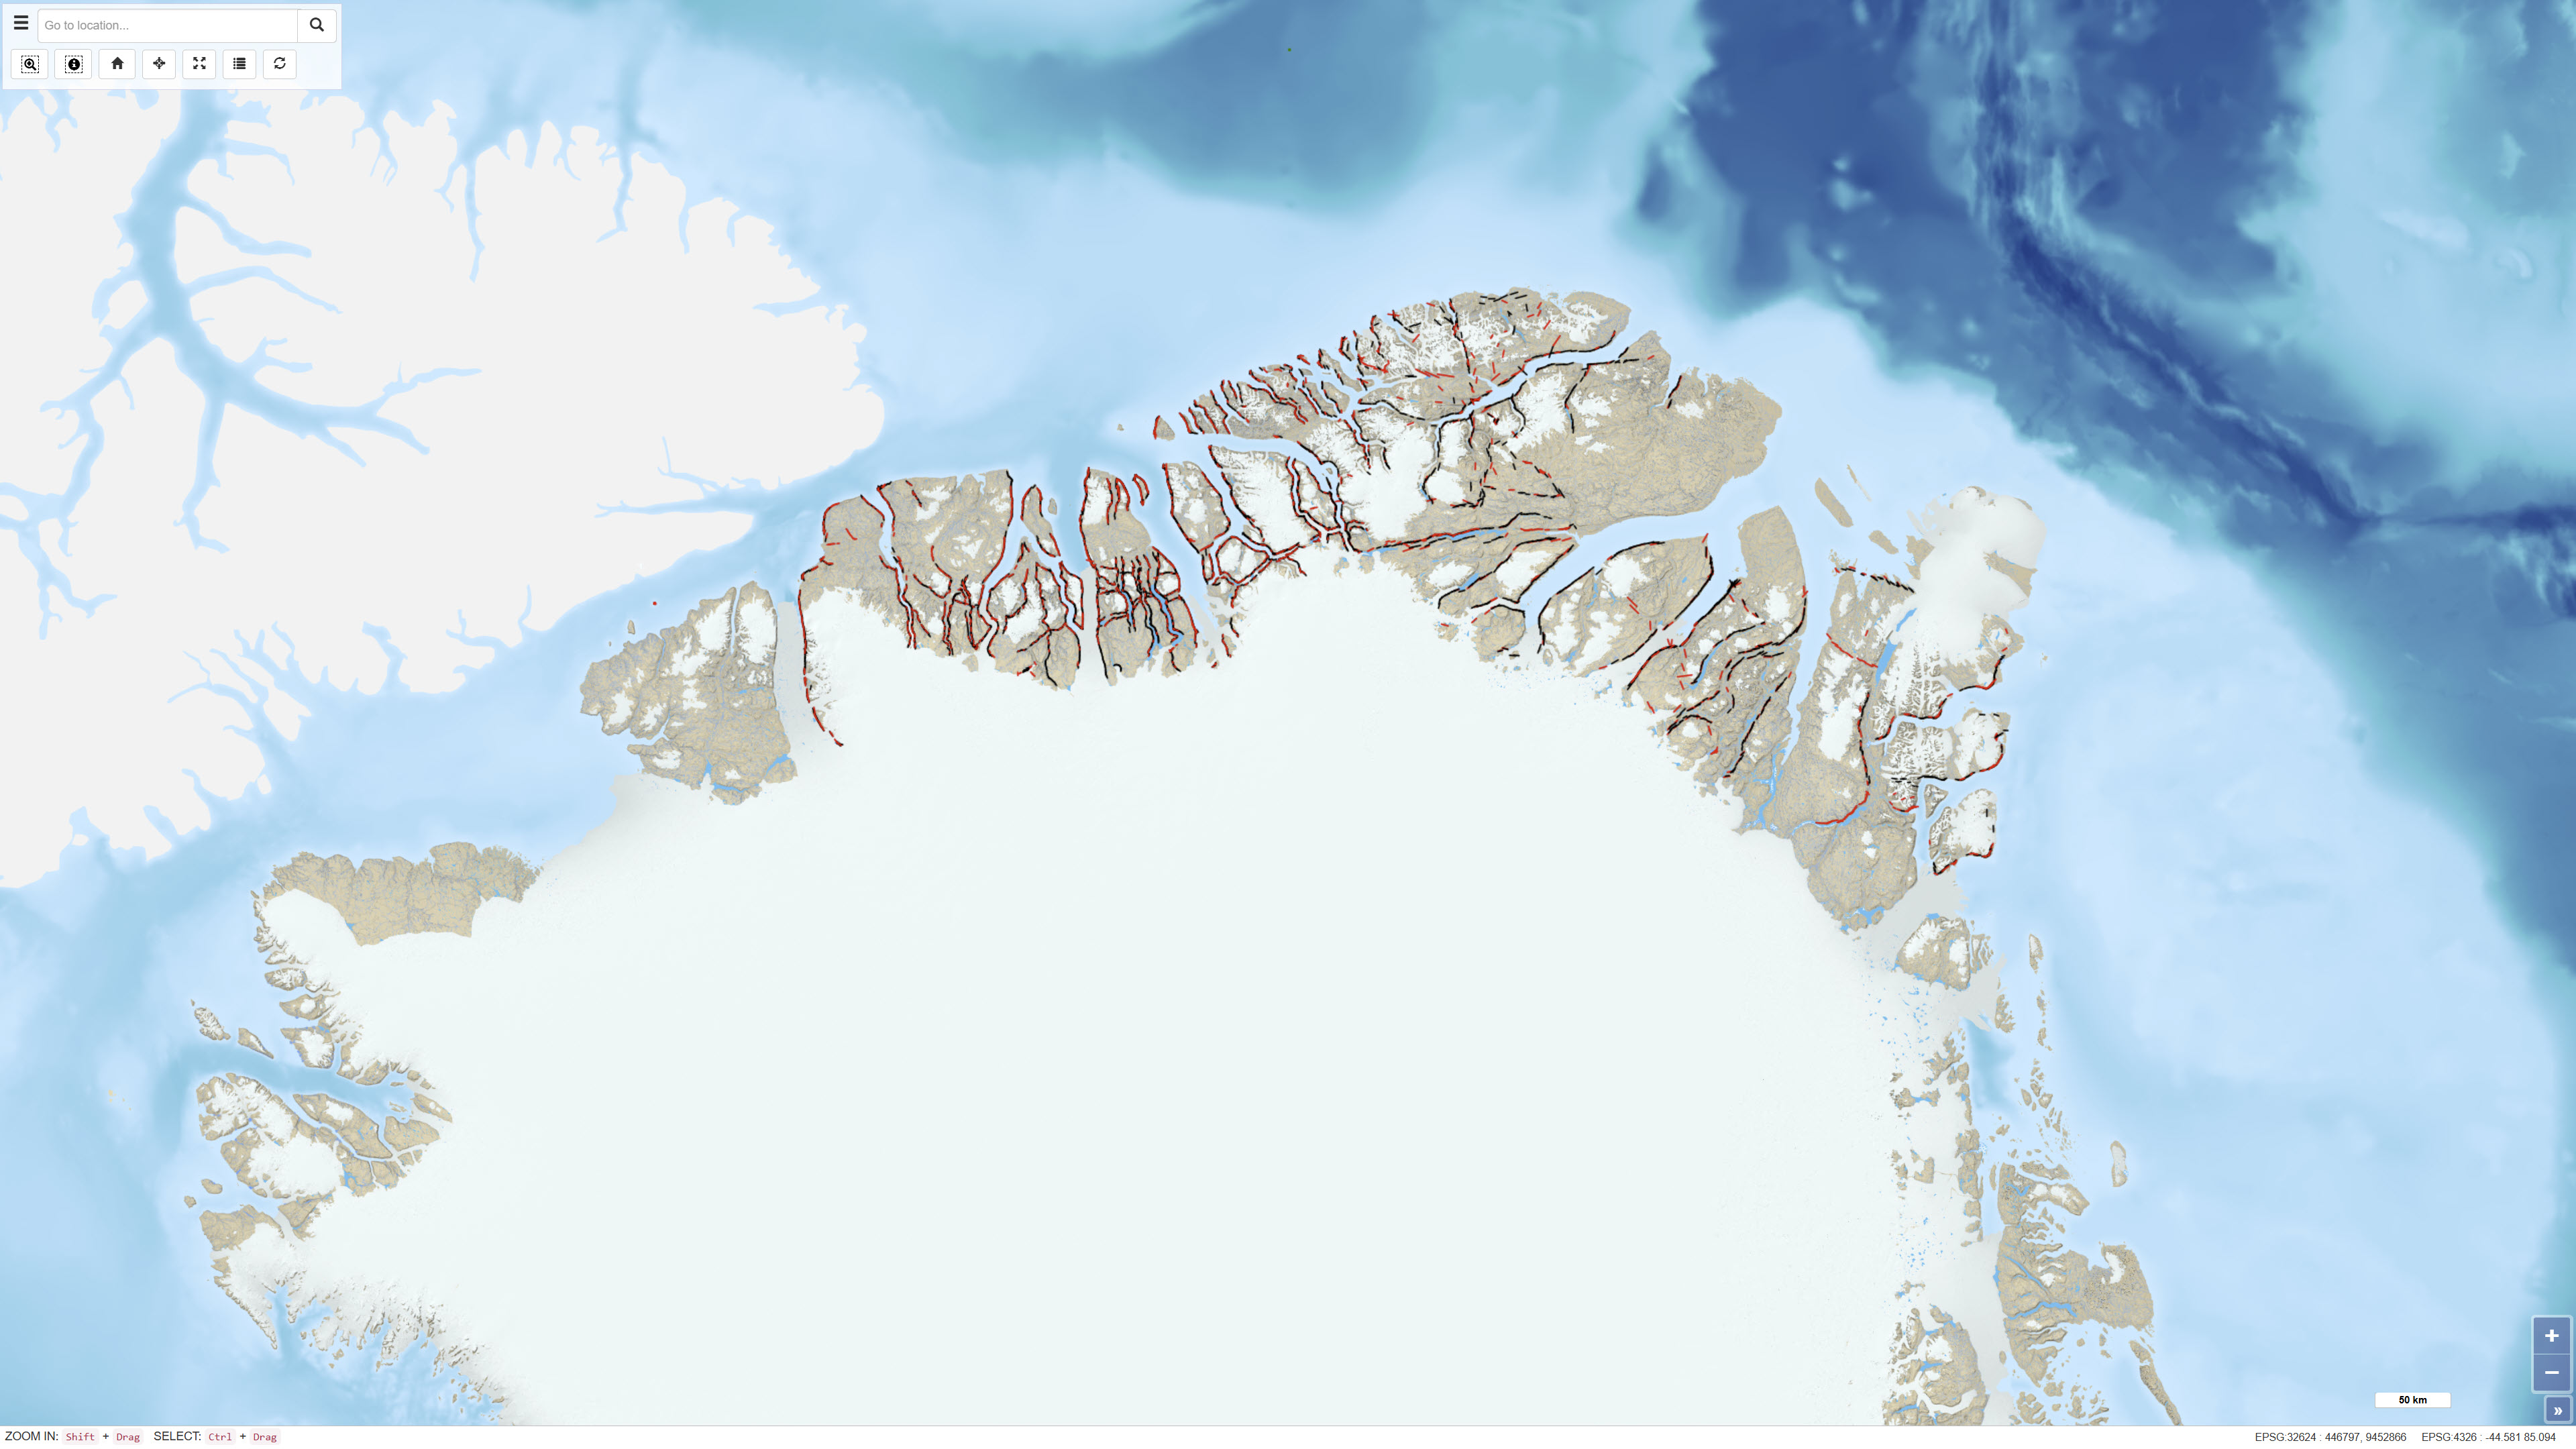
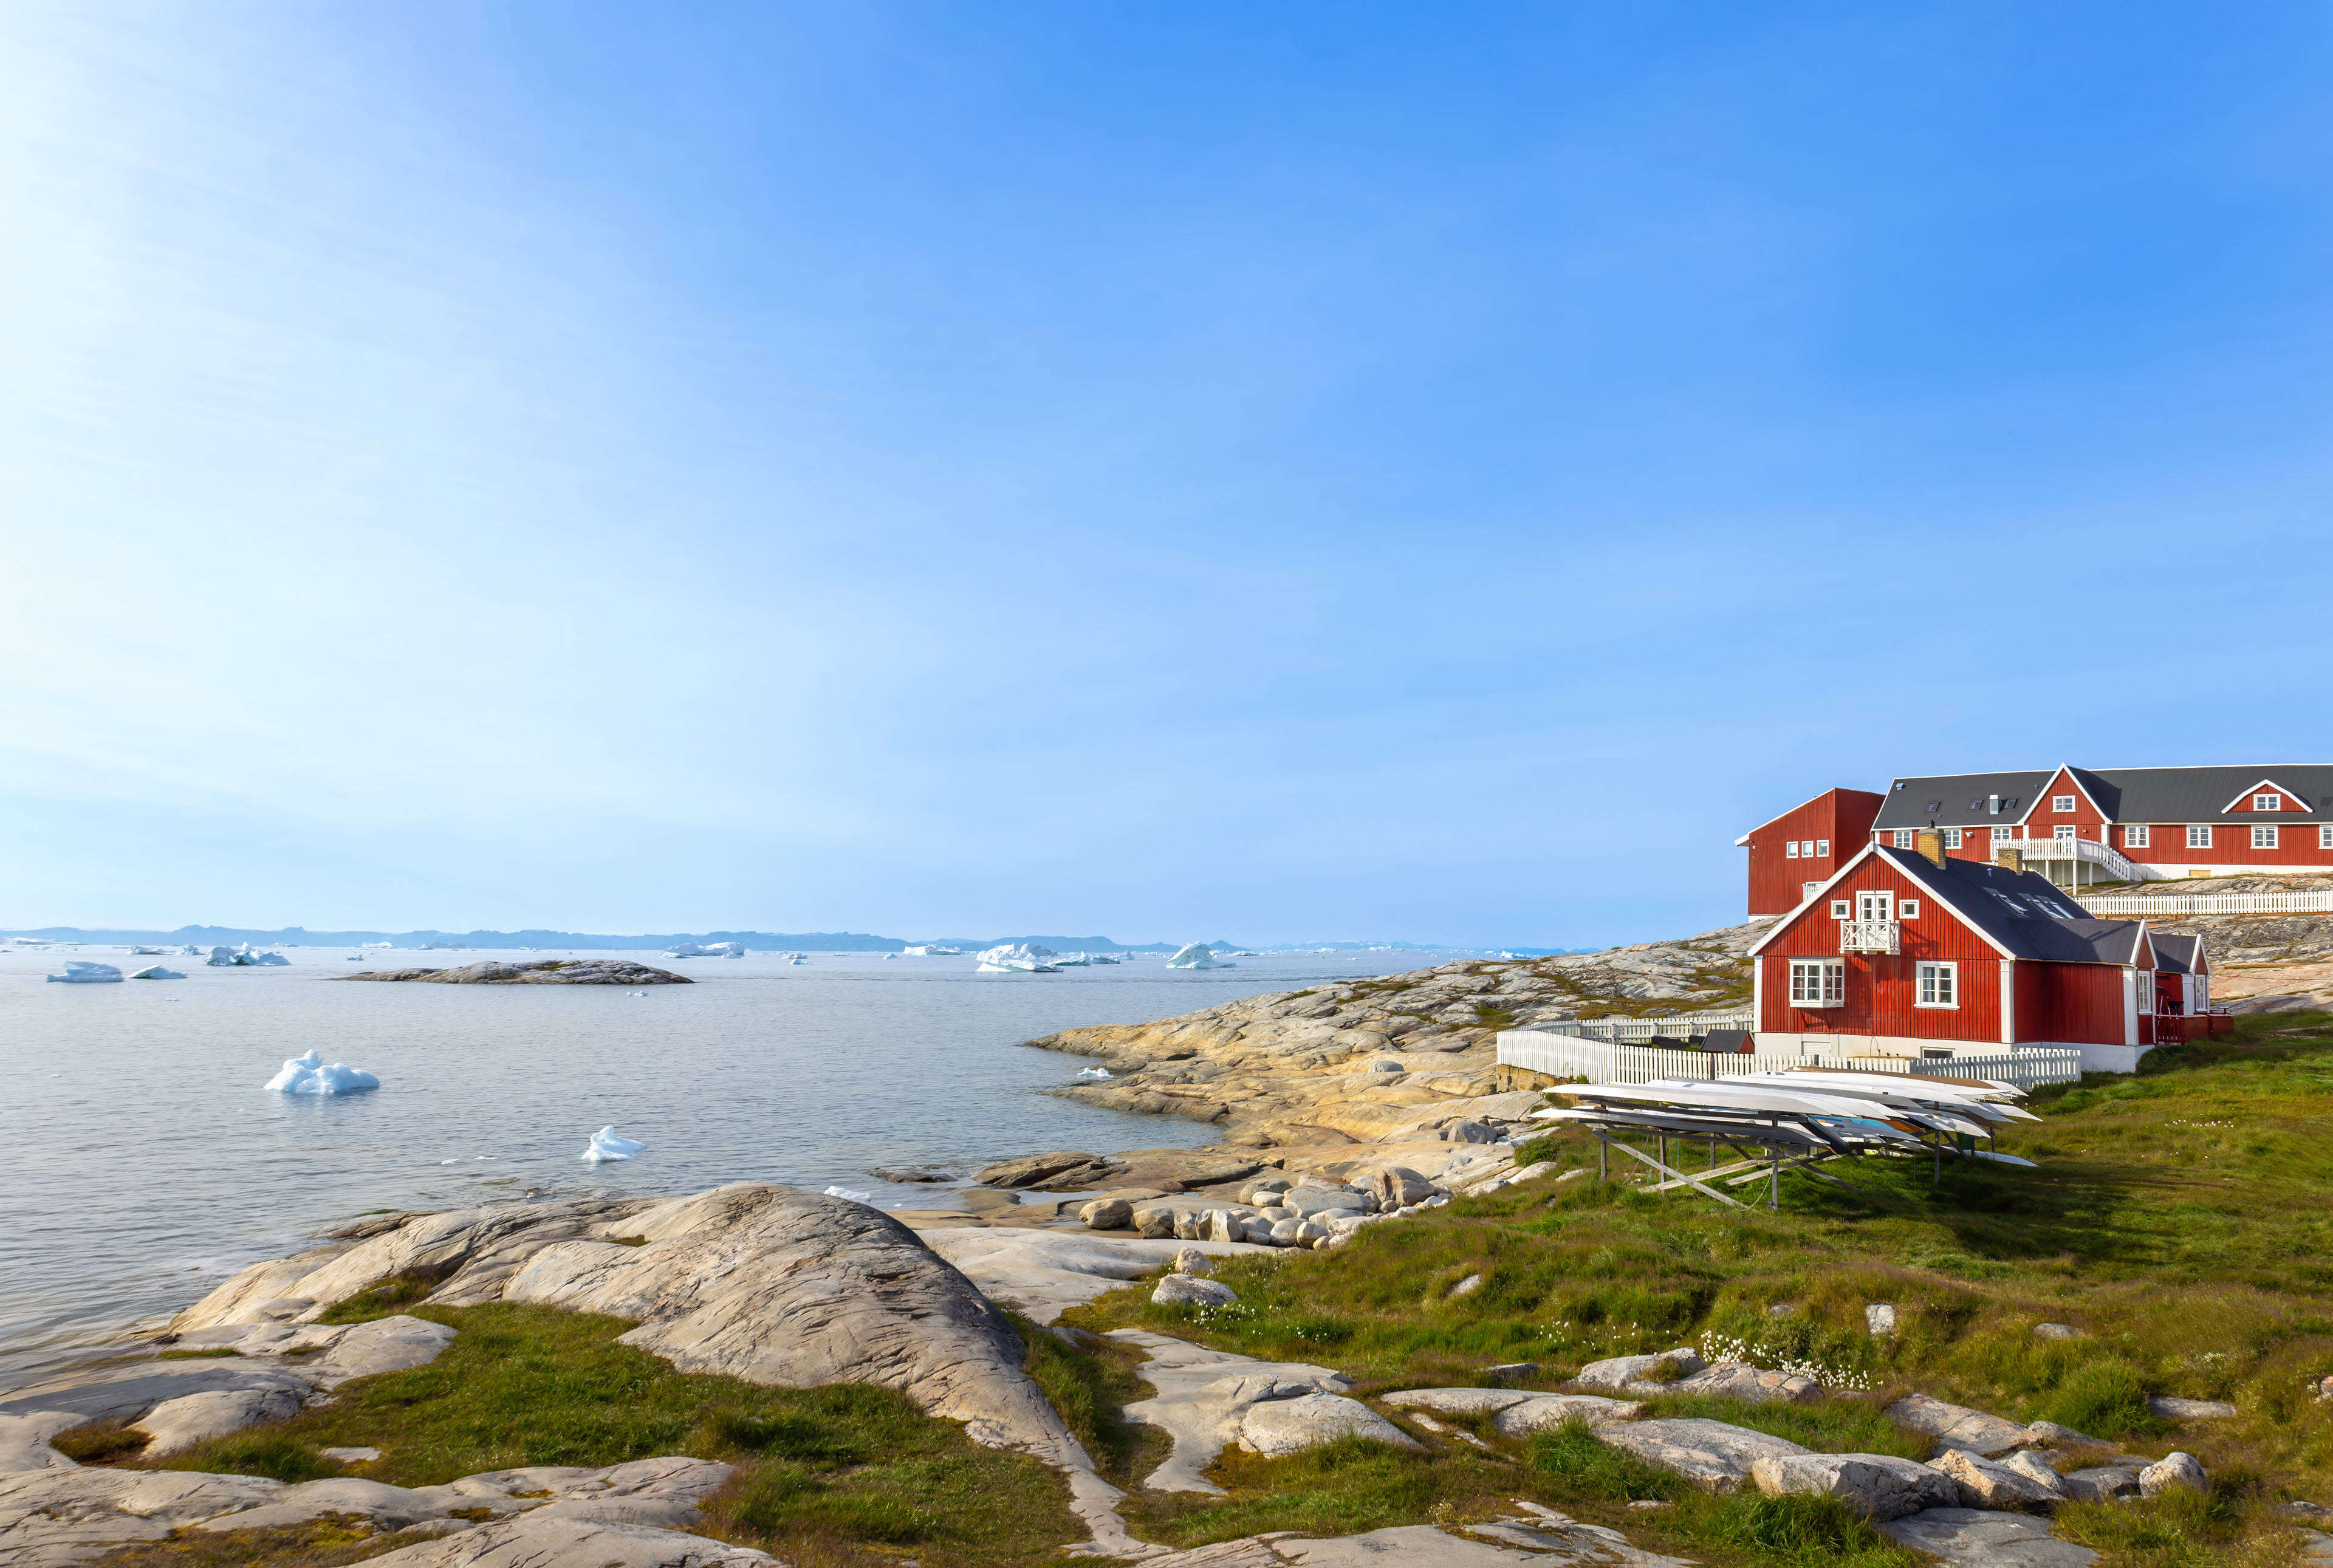
The dataset comprises more than 6,400 oblique aerial photographs acquired during the systematic 1:500,000 geological mapping programme in North Greenland carried out by the Geological Survey of Greenland (now GEUS) between 1978 and 1985. The photographs document steep fjord and valley walls and were collected as part of geological field investigations. The images have been digitised and made available through a web-based interface, allowing users to access individual photographs, their geographic locations and associated geological coding linked to the regional geological map. The dataset represents a systematic visual documentation of geological features in North and Northeast Greenland.
-
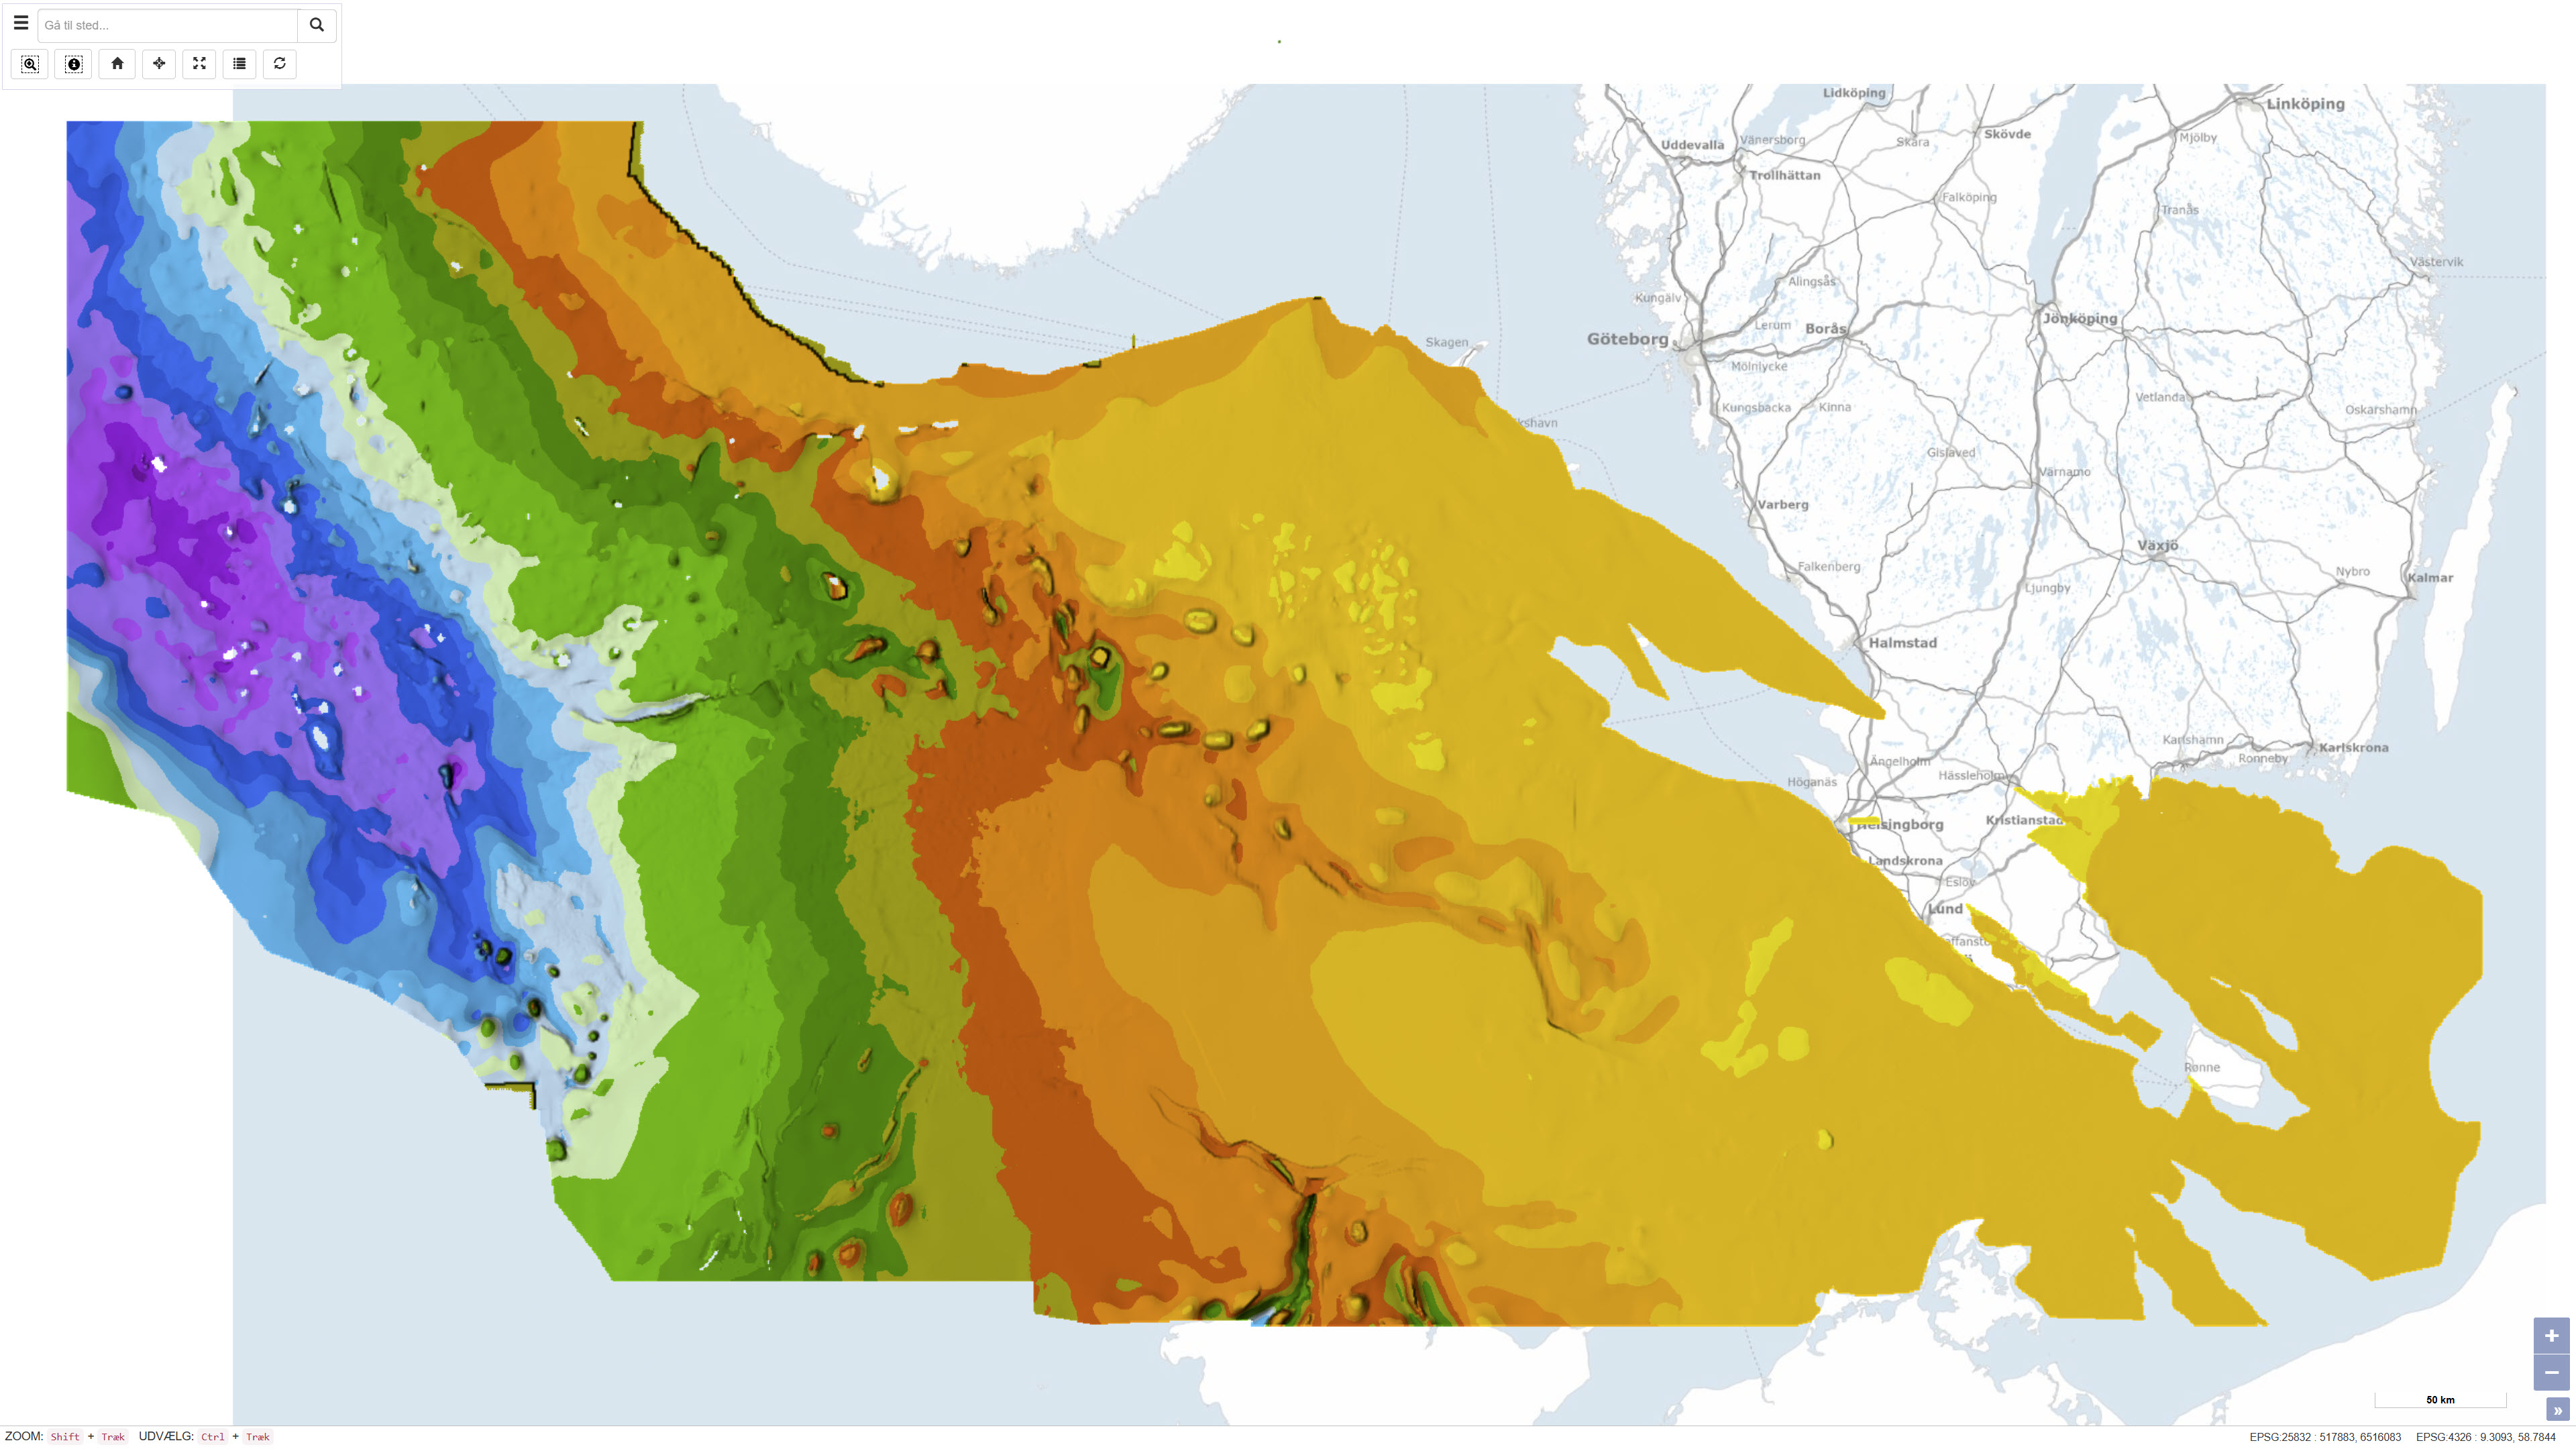
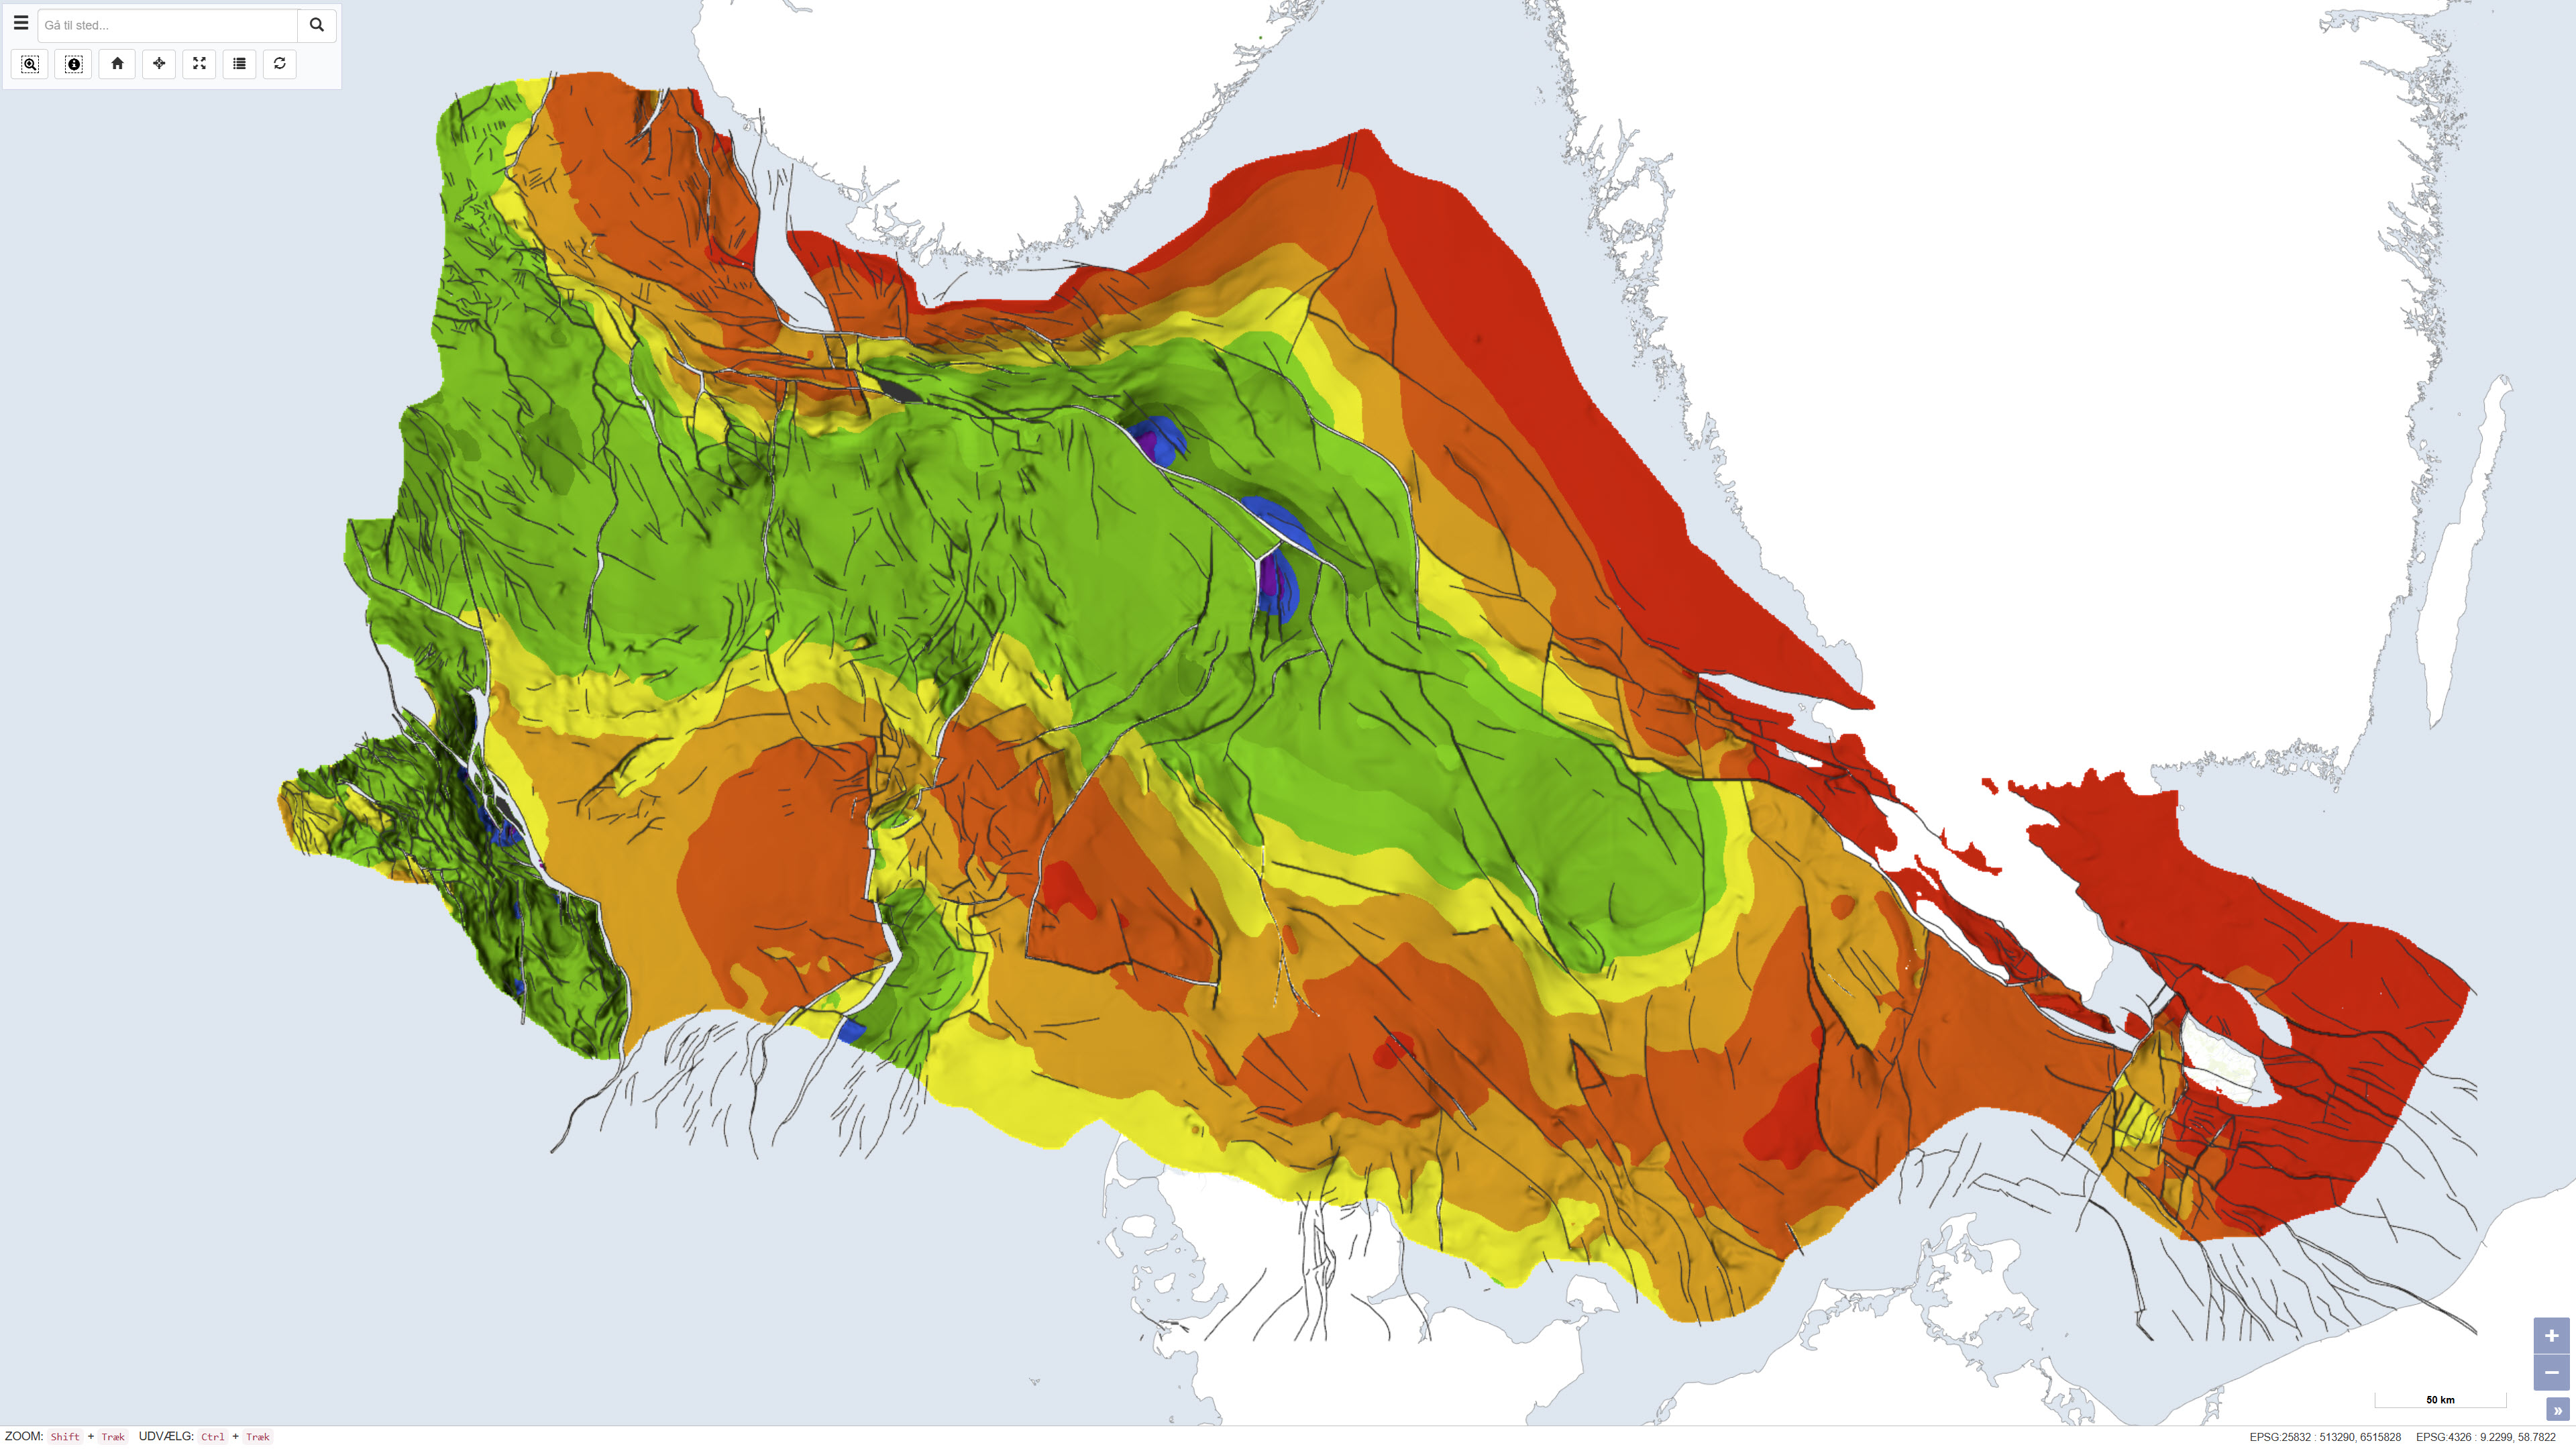
This dataset represents the structure and topography of the Top Chalk surface, i.e. the top of the Chalk Group (including Upper Cretaceous to Danian), in the Danish subsurface. The map illustrates regional variations in the depth and structural configuration of the chalk surface from the central North Sea to the eastern Danish areas. It is based on an integrated geological and geophysical interpretation of seismic profiles, well data and earlier mapping. The map provides an essential basis for geological, geophysical and subsurface reservoir analyses.
-
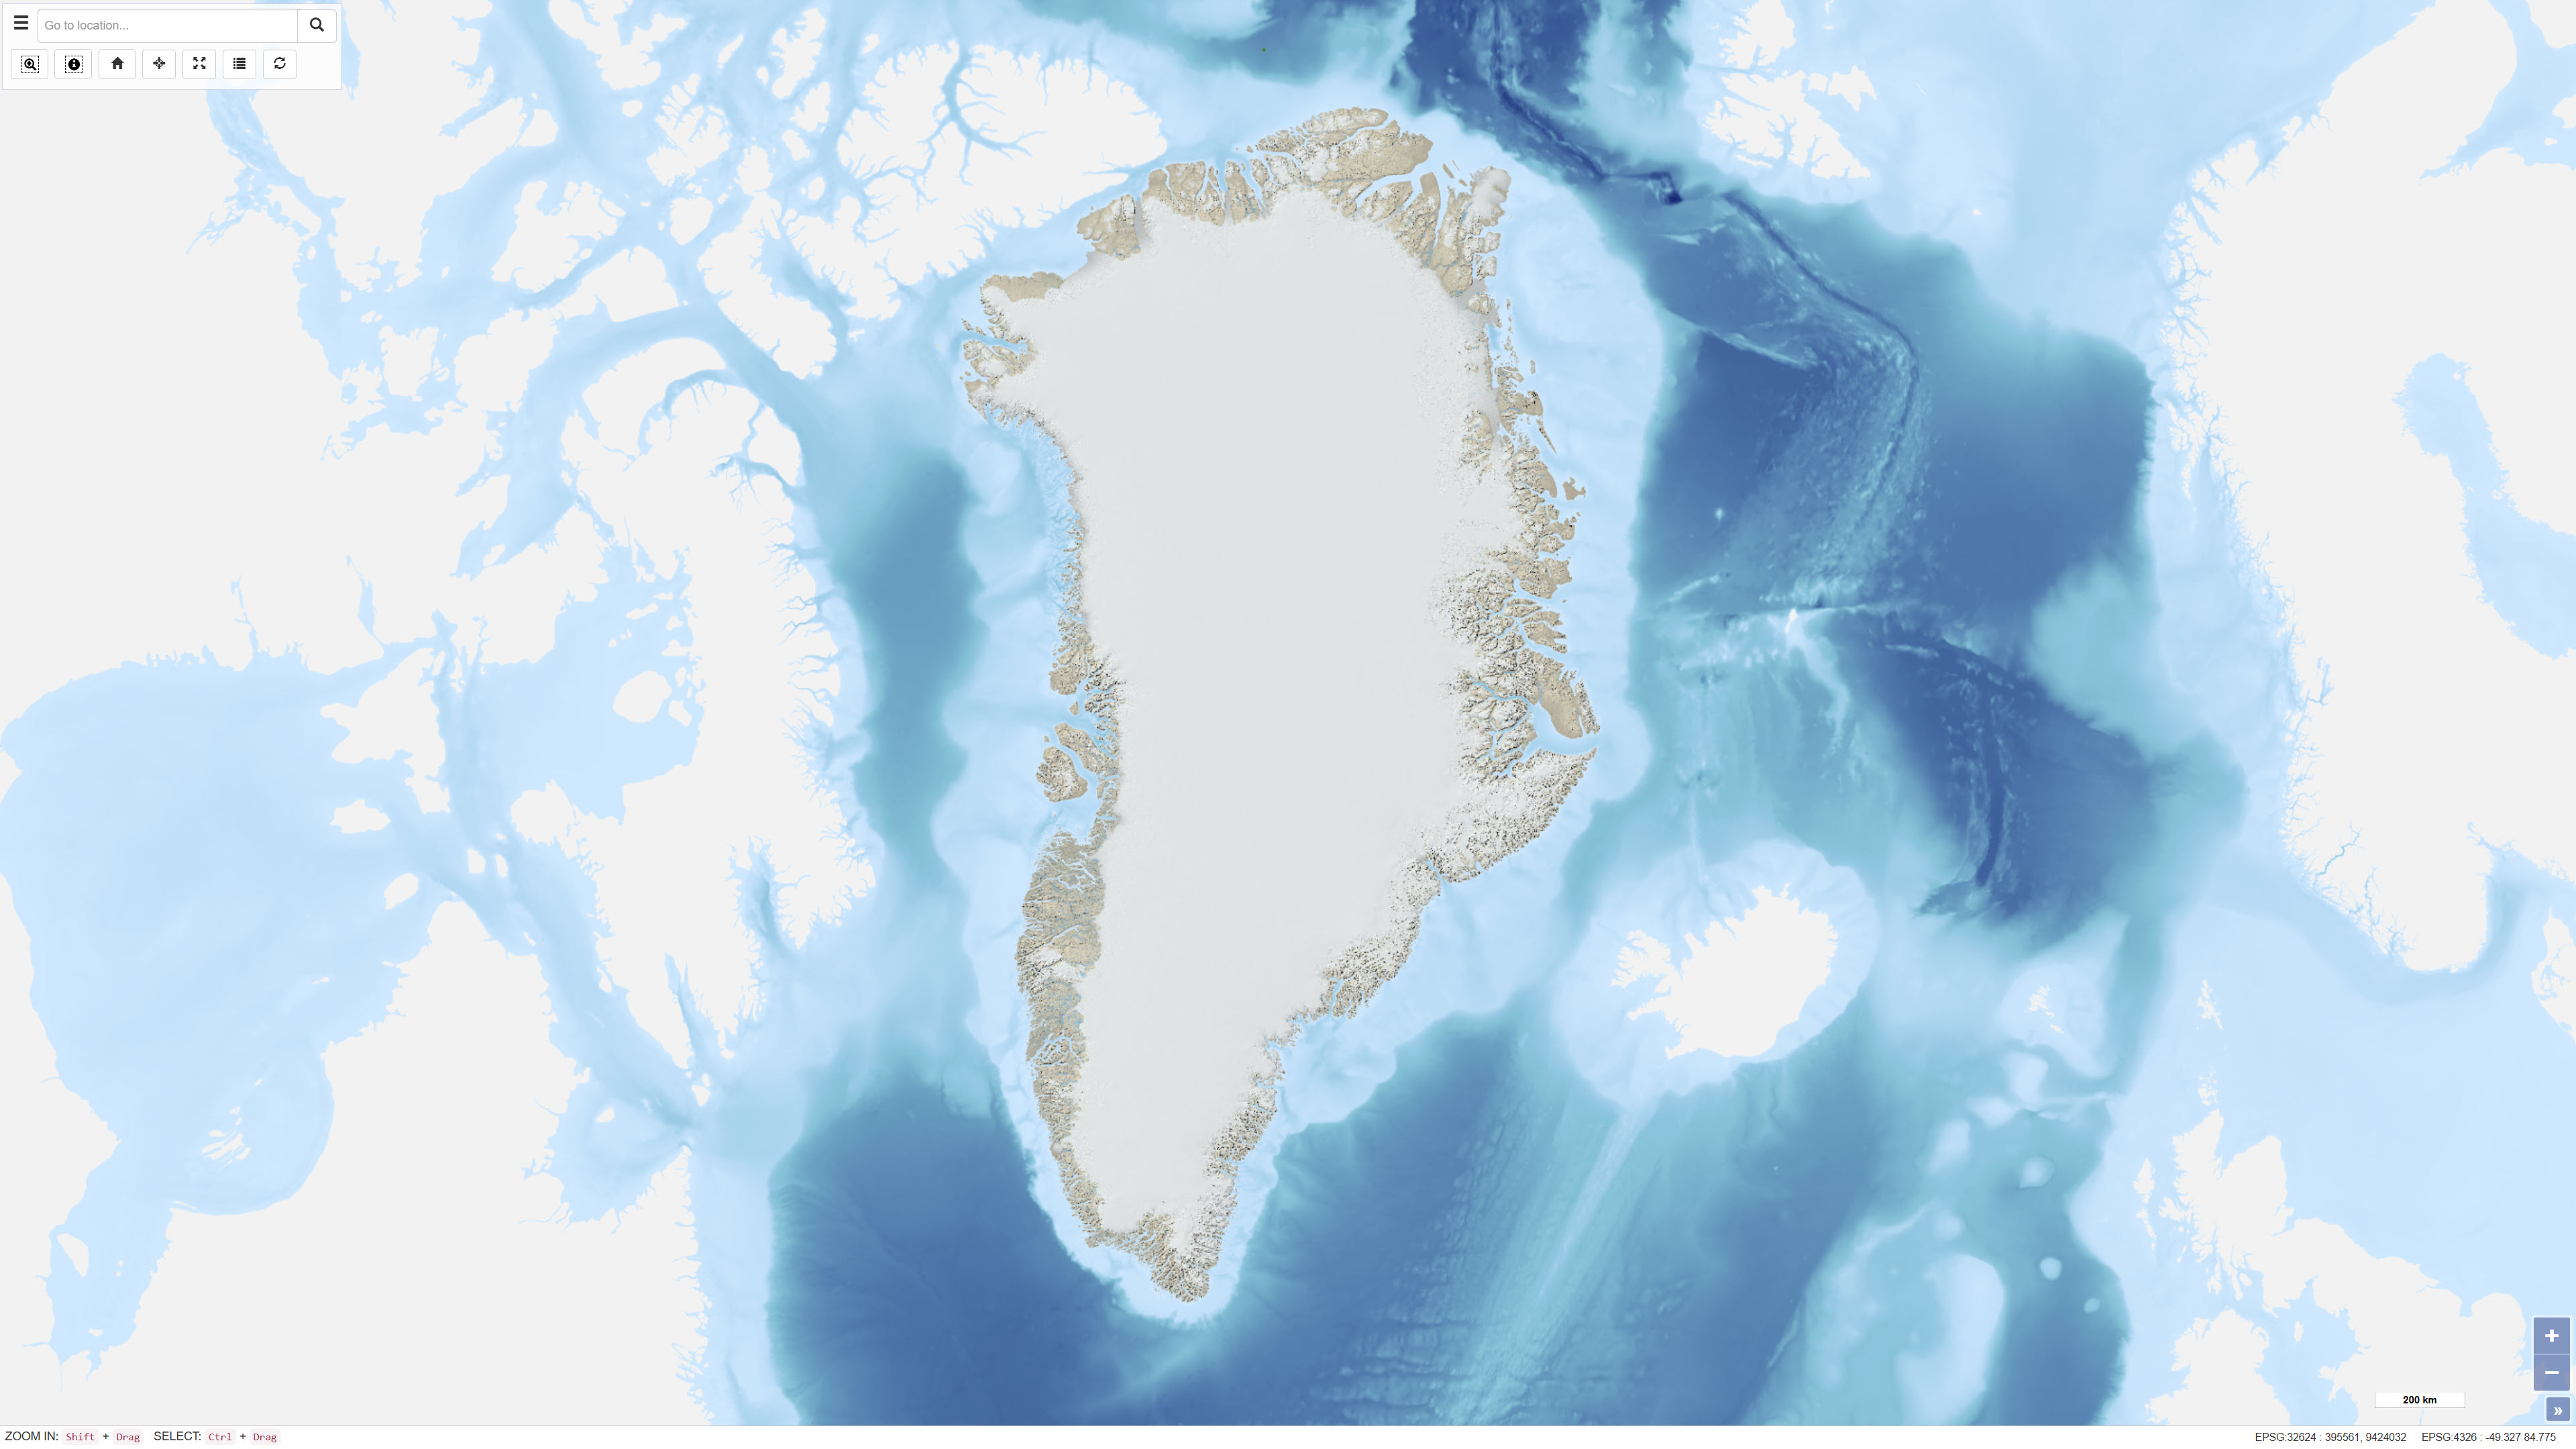
This dataset comprises a multidirectional hillshade raster derived from the Greenland Mapping Project (GIMP) Digital Elevation Model. The hillshade was produced to serve as a semi-transparent overlay for cartographic applications, enhancing terrain depth and surface detail while preserving the original colour characteristics of underlying map layers. The multidirectional illumination method reveals terrain variation from multiple light directions, providing improved representation of landforms compared to traditional single-direction hillshading. The dataset is intended for visualisation purposes in web maps and other cartographic products.
-
The dataset contains terrain models of towns and settlements across Greenland delivered by Asiaq and prepared in connection with the Landslide Project 2022. The dataset includes recorded infrastructure such as roads, buildings and administrative boundaries, as well as a comprehensive raster mosaic of elevation models covering all towns and settlements.
-
This dataset depicts the depth to the top of the pre-Zechstein succession in the Danish subsurface. The map represents the structural surface beneath the Zechstein evaporites and provides a regional overview of the geological framework of the subsurface. The dataset is based on interpretation of seismic data, deep boreholes and previous geological mapping and was produced as part of the Geological Survey of Denmark map series no. 45. The map is used as a reference for regional structural geology and subsurface modelling.
-
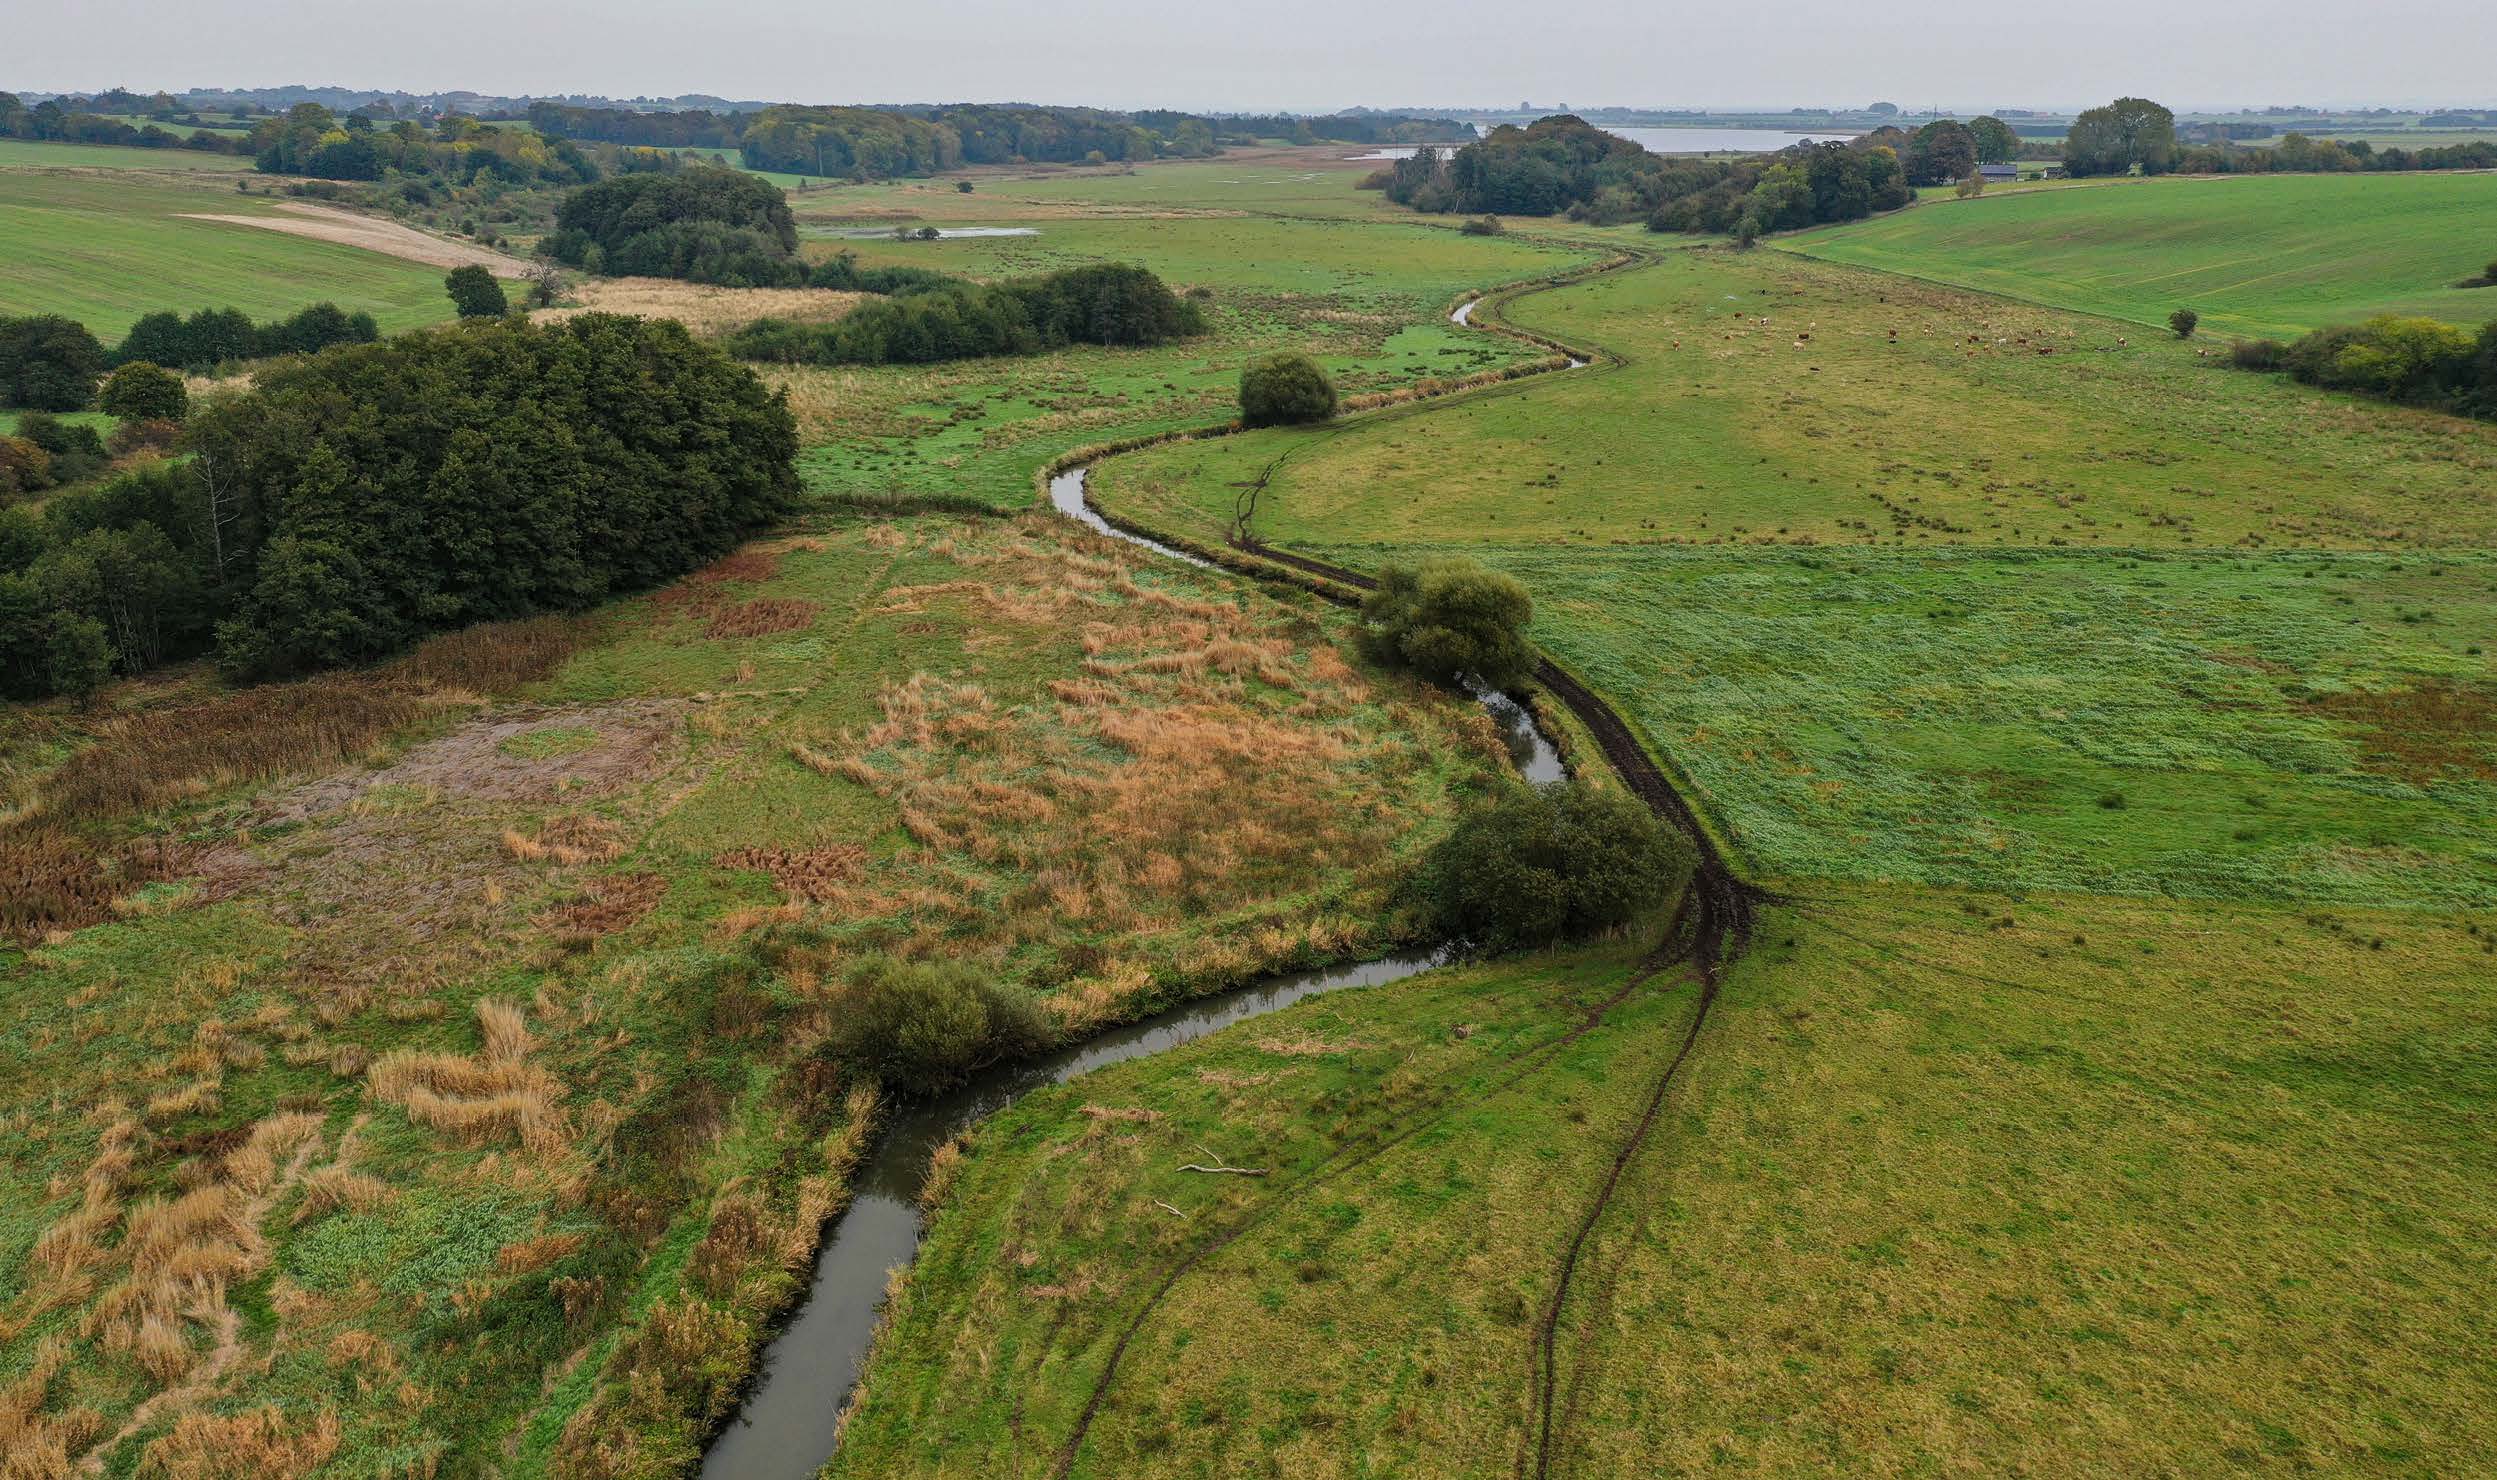
This repository contains three national nitrogen retention maps for Denmark and associated uncertainties. “TotalRetention_regioner.tif” is the total retention (nitrogen removal) from the source location to the coast, “Grundvandsretention_regioner.tif” is the retention during transport in the groundwater and “Overfladevandsretention.tif” is the retention in the surface water system, i.e. streams, lakes, wetlands and inundated areas. The maps for the total and groundwater retention are aggregated from a 100 m grid into regions with a minimum size of 50 ha based on similarity between neighbouring grids. For surface water, the spatial resolution is defined as the contribution catchment discharging to the individual retention environments, e.g. a lake catchment. The total retention is supplemented by two maps “TotalRetention_usikkerhed_regioner.tif” showing the uncertainty in the total retention estimated for each region and “TotalRetention_standardafvigelse_regioner.tif” displaying the standard deviation between the individual grids within each region. All maps are calculated using data for the period 2000 – 2021. The nitrogen retention maps have been developed in a collaboration between GEUS and Aarhus University. (2025-08-29).
-
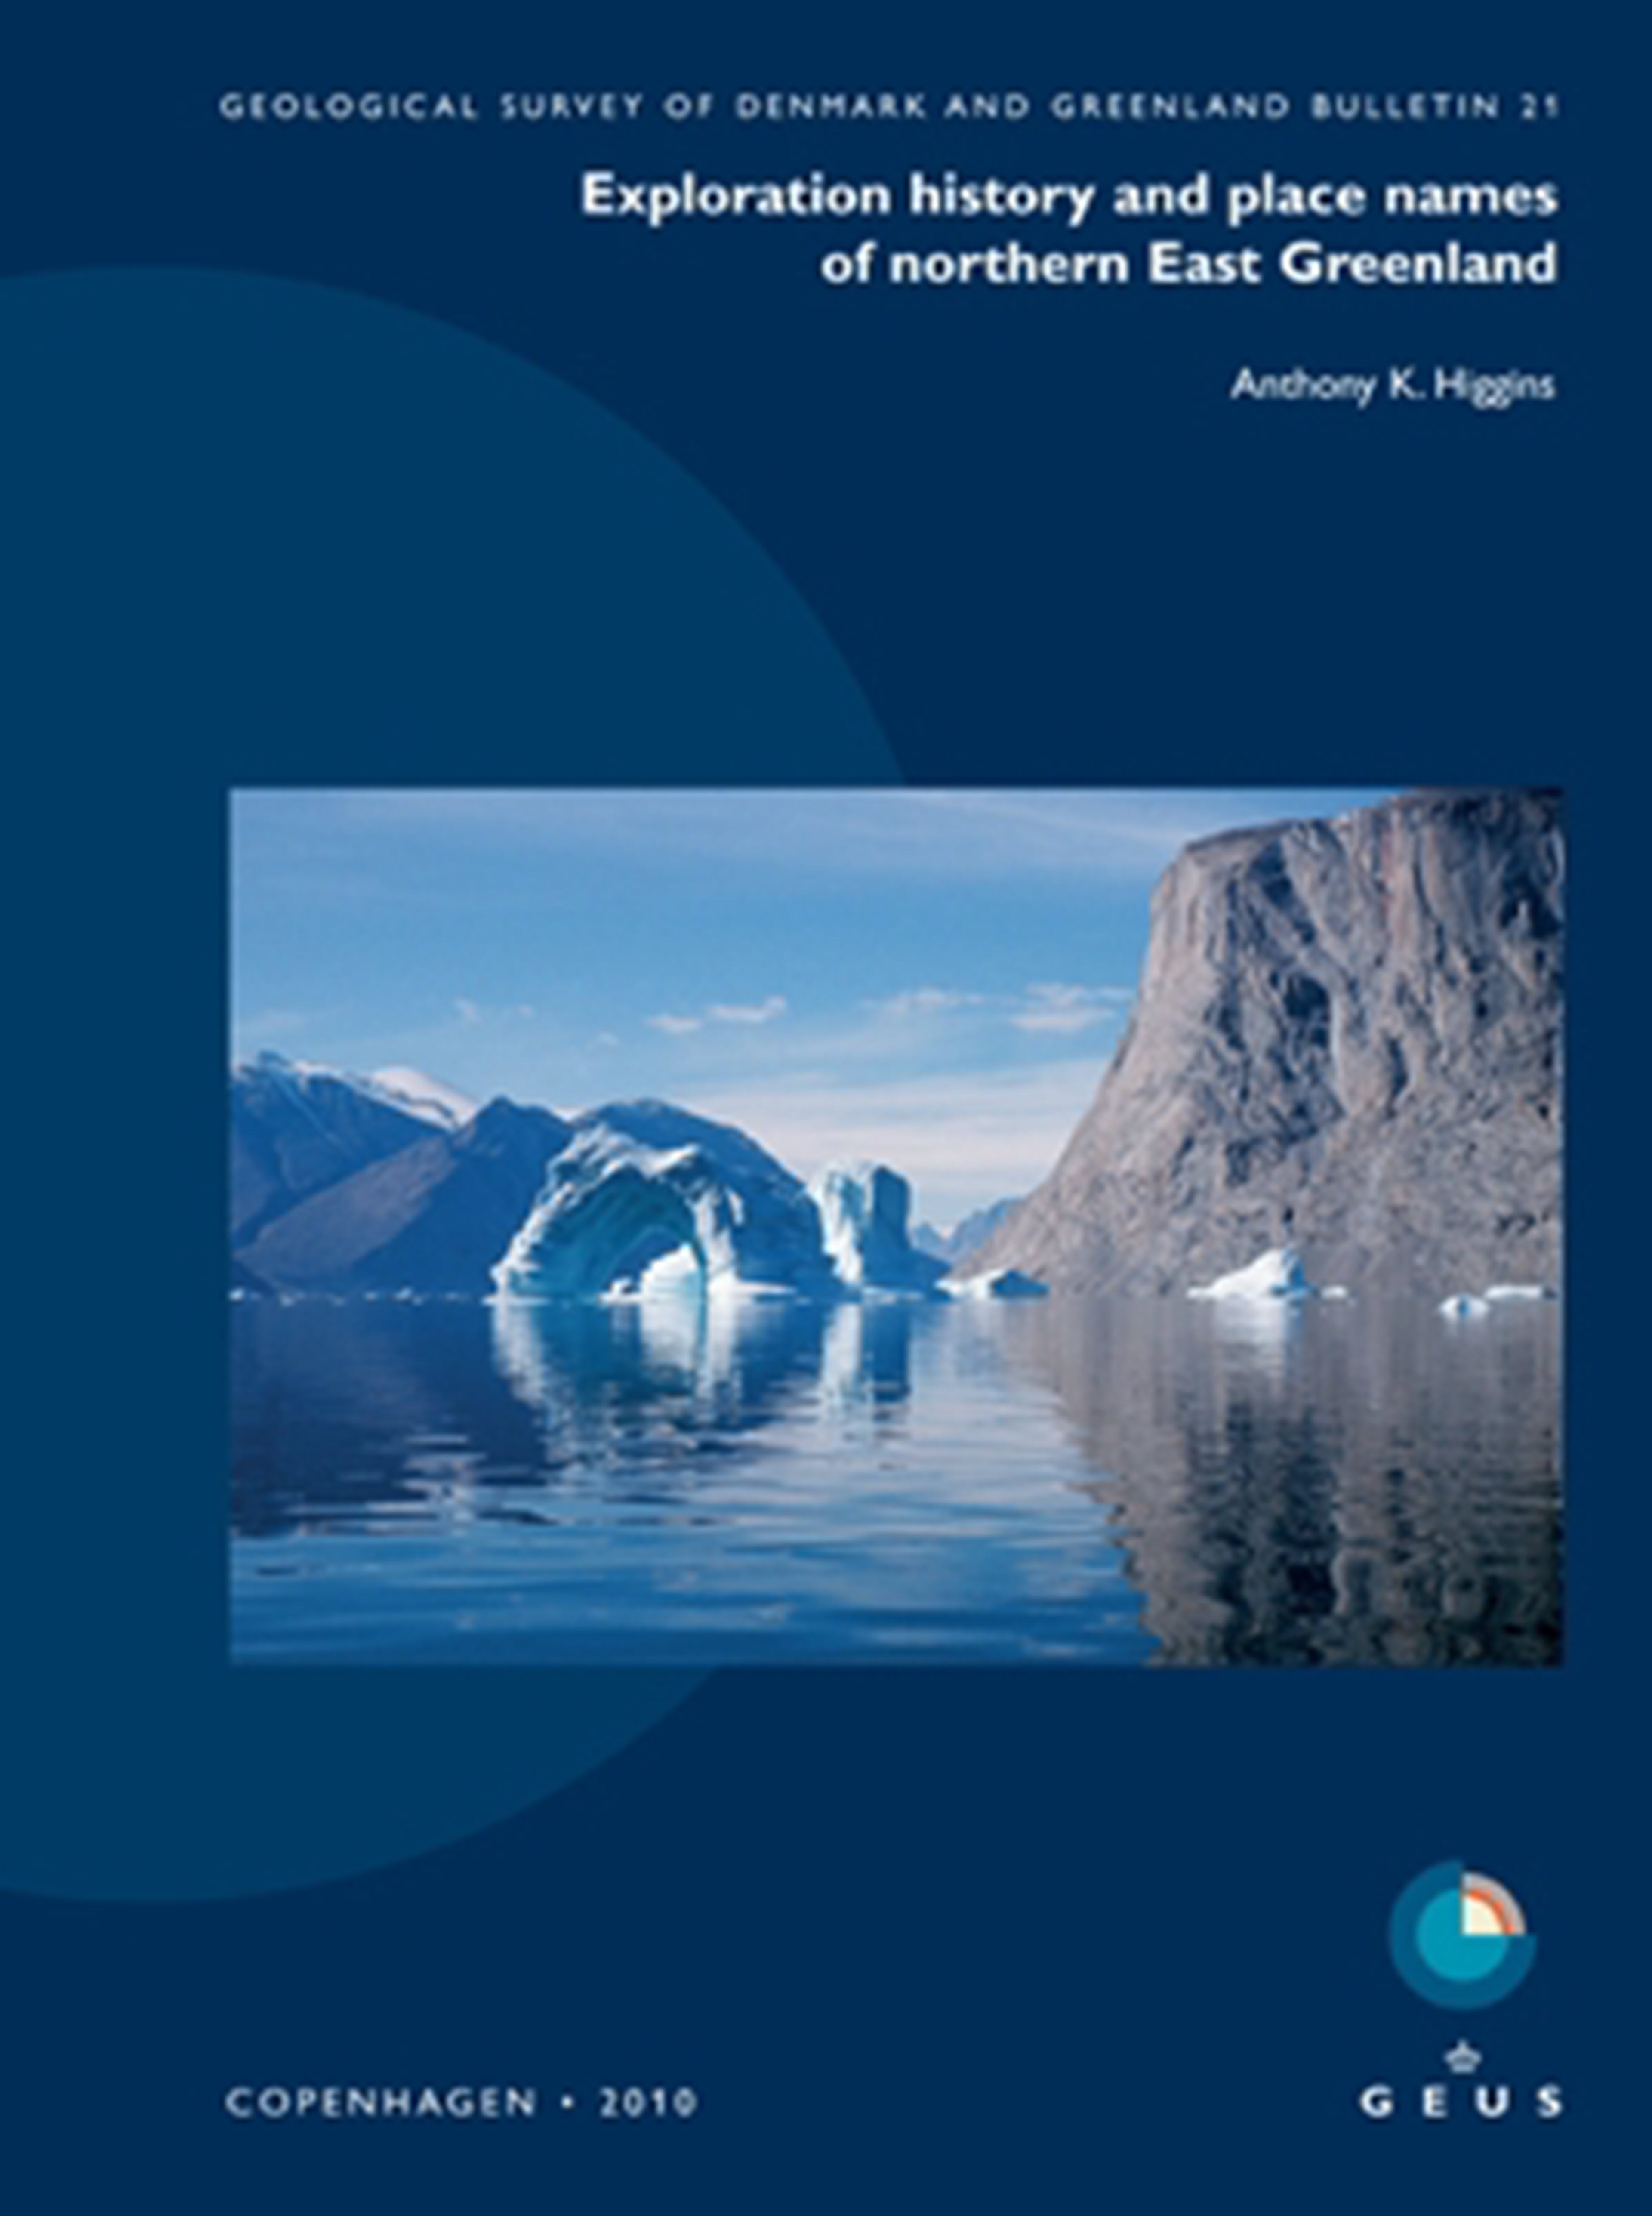
The dataset contains place names and associated historical and explanatory information for Northern East Greenland based on the book Northern East Greenland’s research history and place names by A.K. Higgins, published by GEUS in 2010. The dataset includes geographic locations of place names together with their explanations and historical background. The original maps and place name information have been converted to a web-based GIS format, allowing users to search for place names via free-text search and view their spatial distribution on an interactive map. The dataset forms part of the web-based presentation of Northern East Greenland’s place names and research history.
-
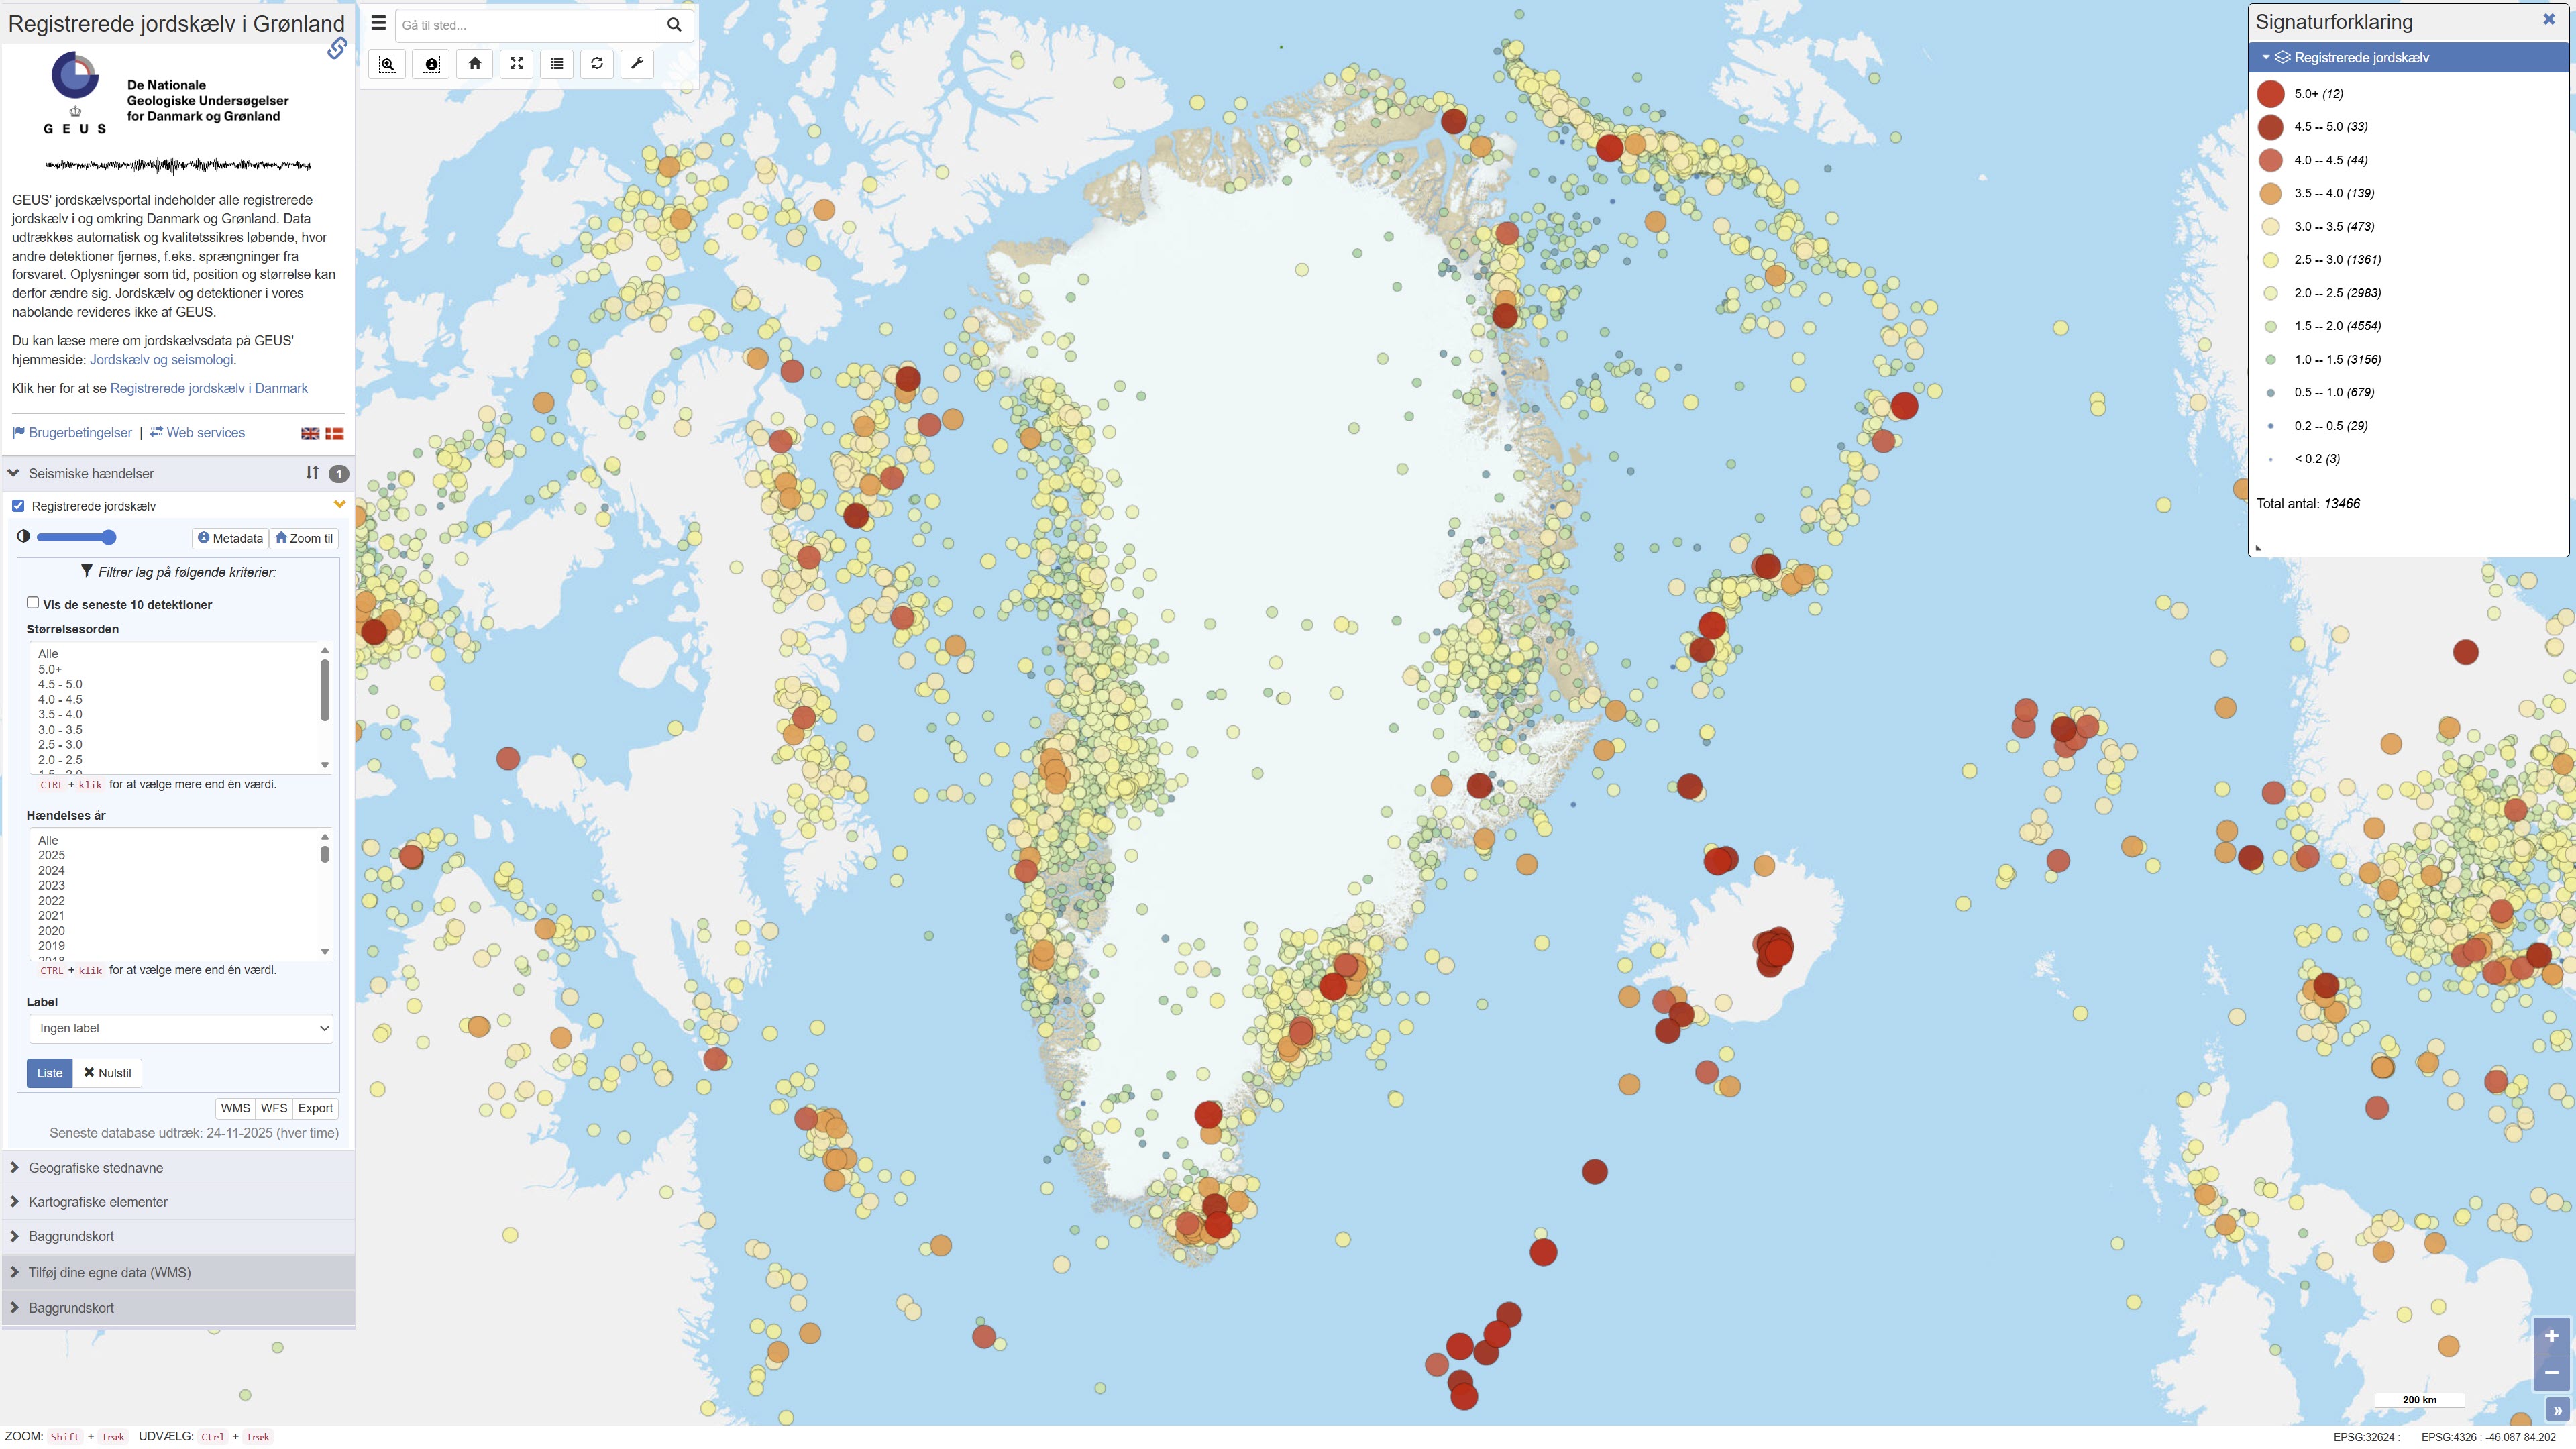
The dataset contains recorded earthquakes and seismic events in Greenland. The data include information on event time, geographic location (epicentre), depth and magnitude for confirmed and suspected earthquakes. The dataset is based on observations from GEUS’ seismic monitoring network and is used for monitoring, research and dissemination of seismic activity in Greenland.
-
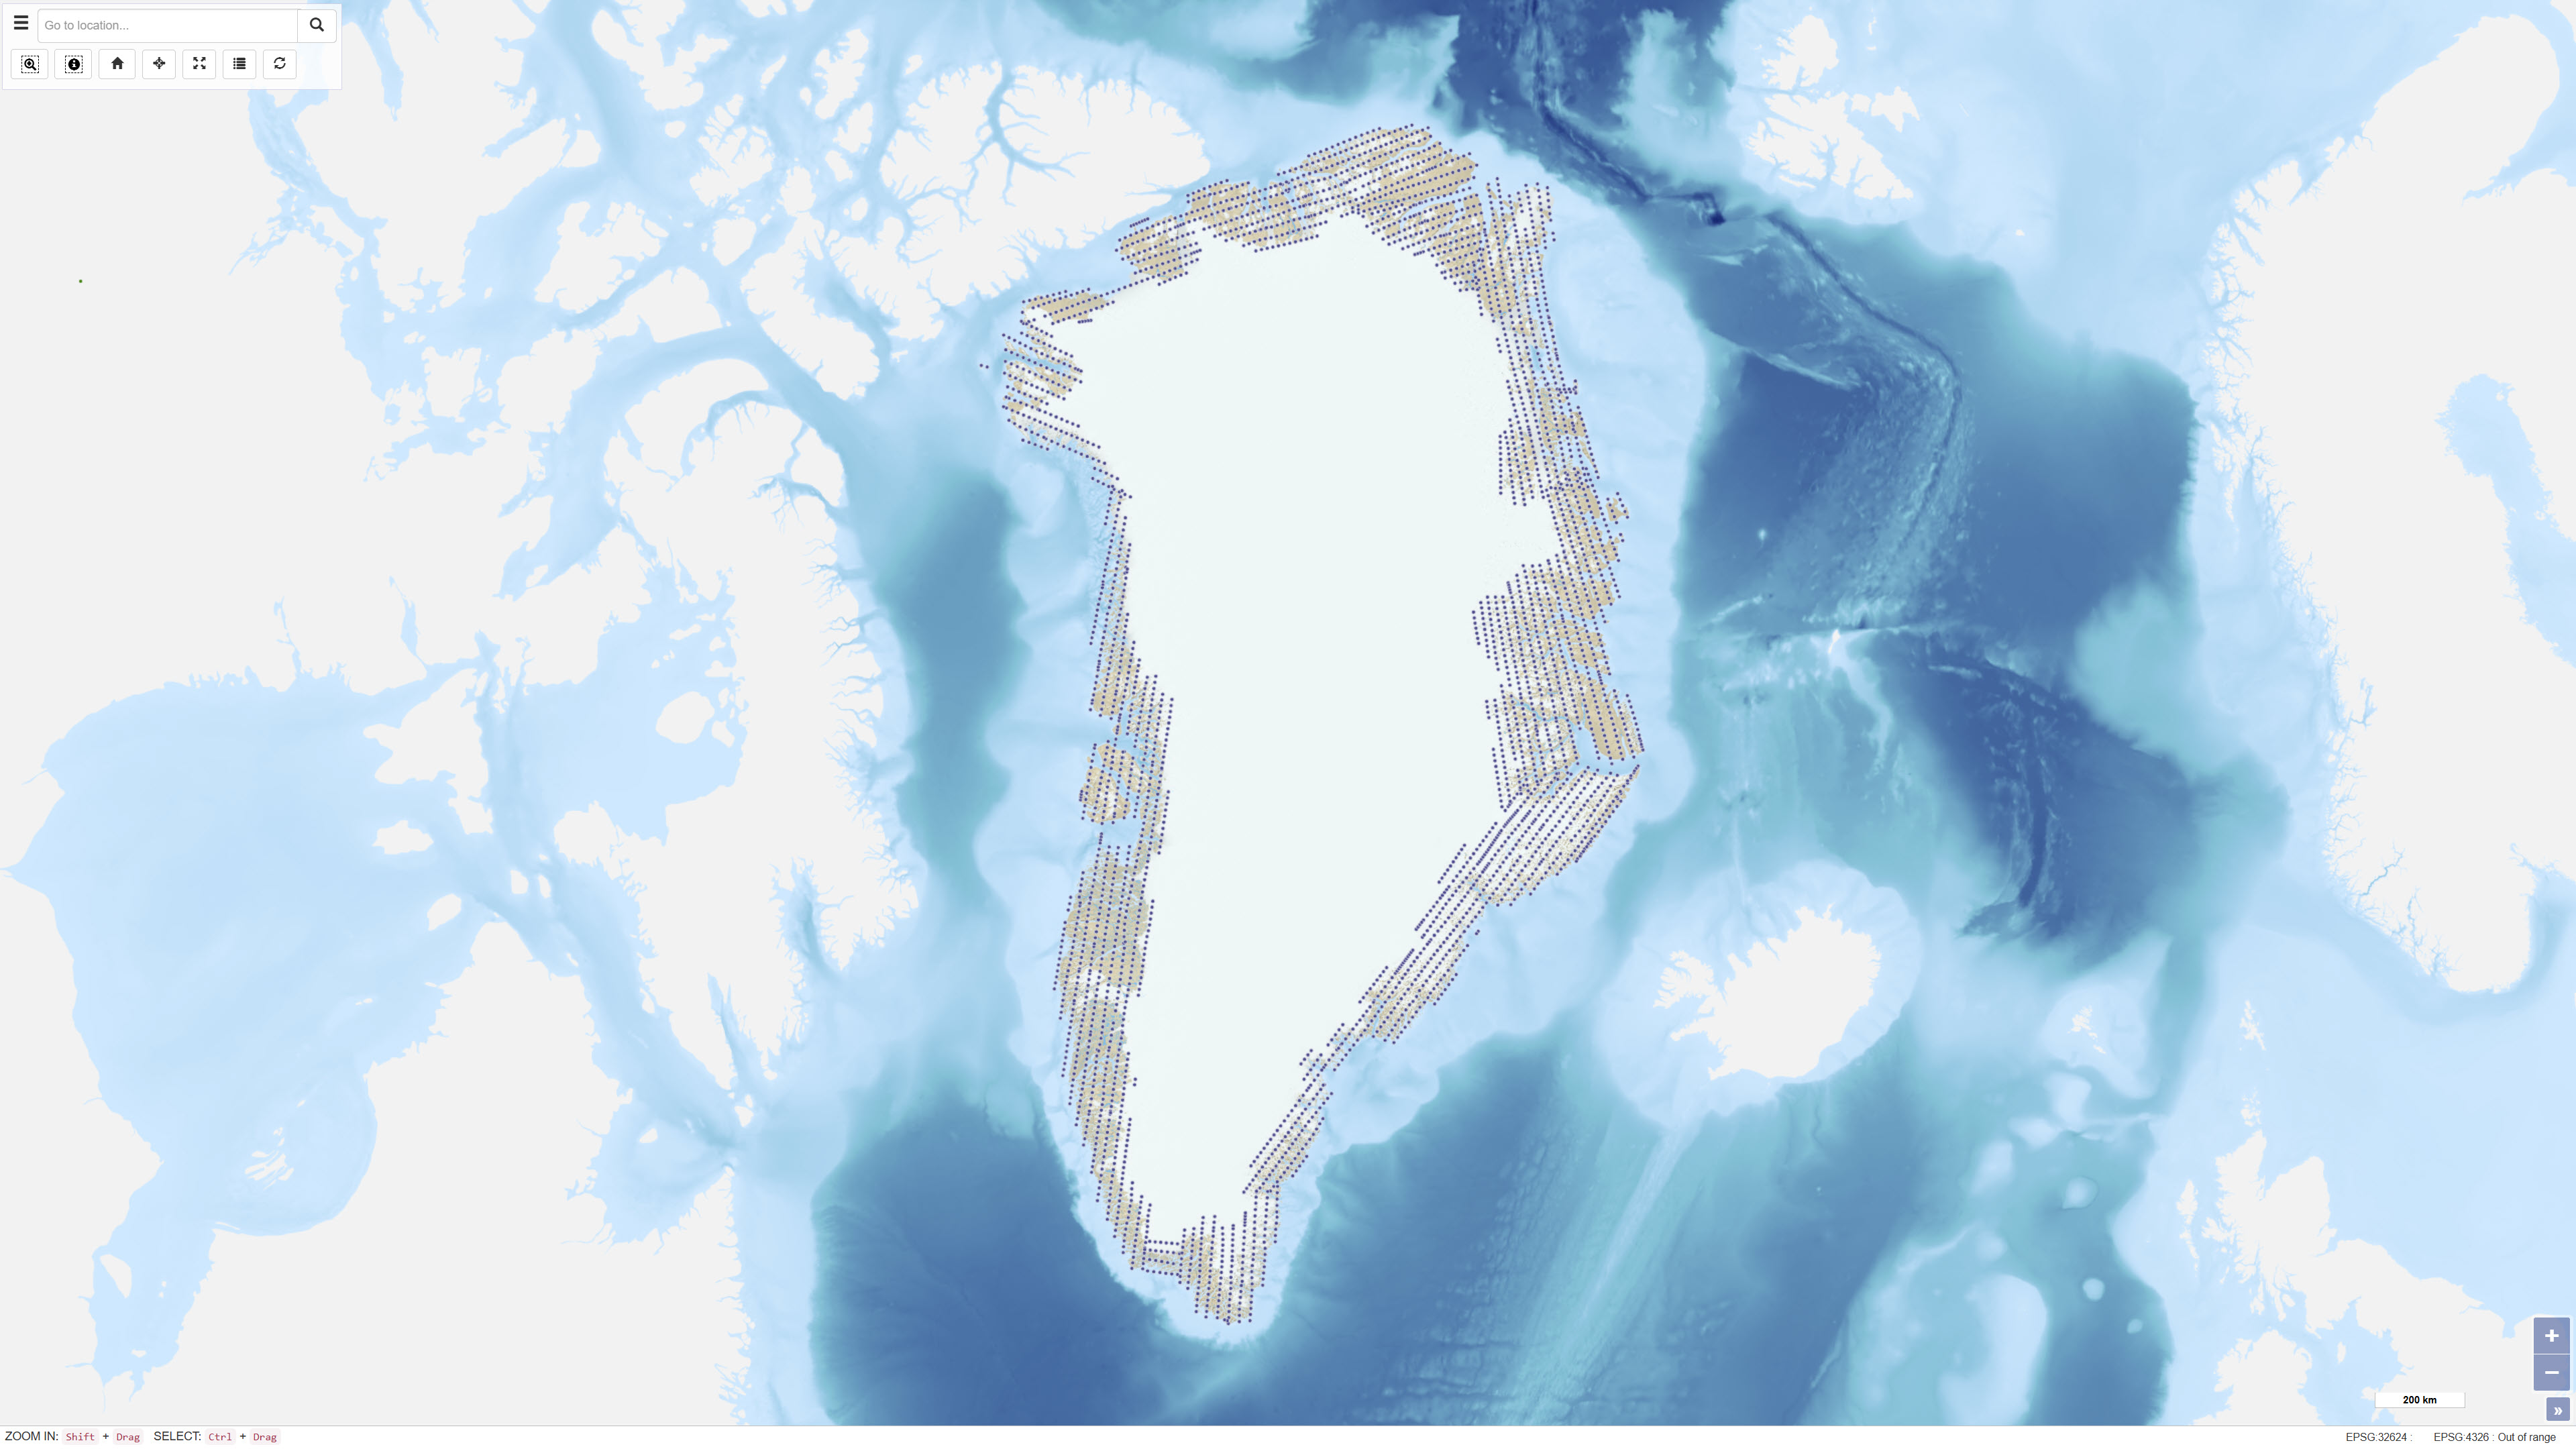
Uniform vertical aerial photographic coverage of Greenland was achieved between 1978 and 1987 at a scale of 1:150.000 by Mark Hurd Aerial Surveys, Inc., Minneapolis, Minnesota, U.S.A., on behalf of the Danish Geodetic Institute. The photography provided systematic nationwide coverage and formed a fundamental reference dataset for mapping and geodetic purposes. The black-and-white photographs were acquired using a Wild RC-10 camera equipped with a super wide-angle lens (focal length 88 mm). The aircraft used was a Gates Learjet 25C, flying at approximately 14 km altitude to achieve the image scale of 1:150.000. To minimise blind areas caused by steep mountain slopes in combination with the wide-angle lens, photographs were acquired with 80% forward overlap and 40% side overlap. Photo centre coordinates were established through aerotriangulation performed by the Danish Geodata Agency. The dataset has subsequently been used for mapping, aerotriangulation and scanning applications.