 Arctic SDI catalogue
250000
Type of resources
Available actions
Topics
Keywords
Contact for the resource
Provided by
Years
Formats
Representation types
Update frequencies
status
Scale
-
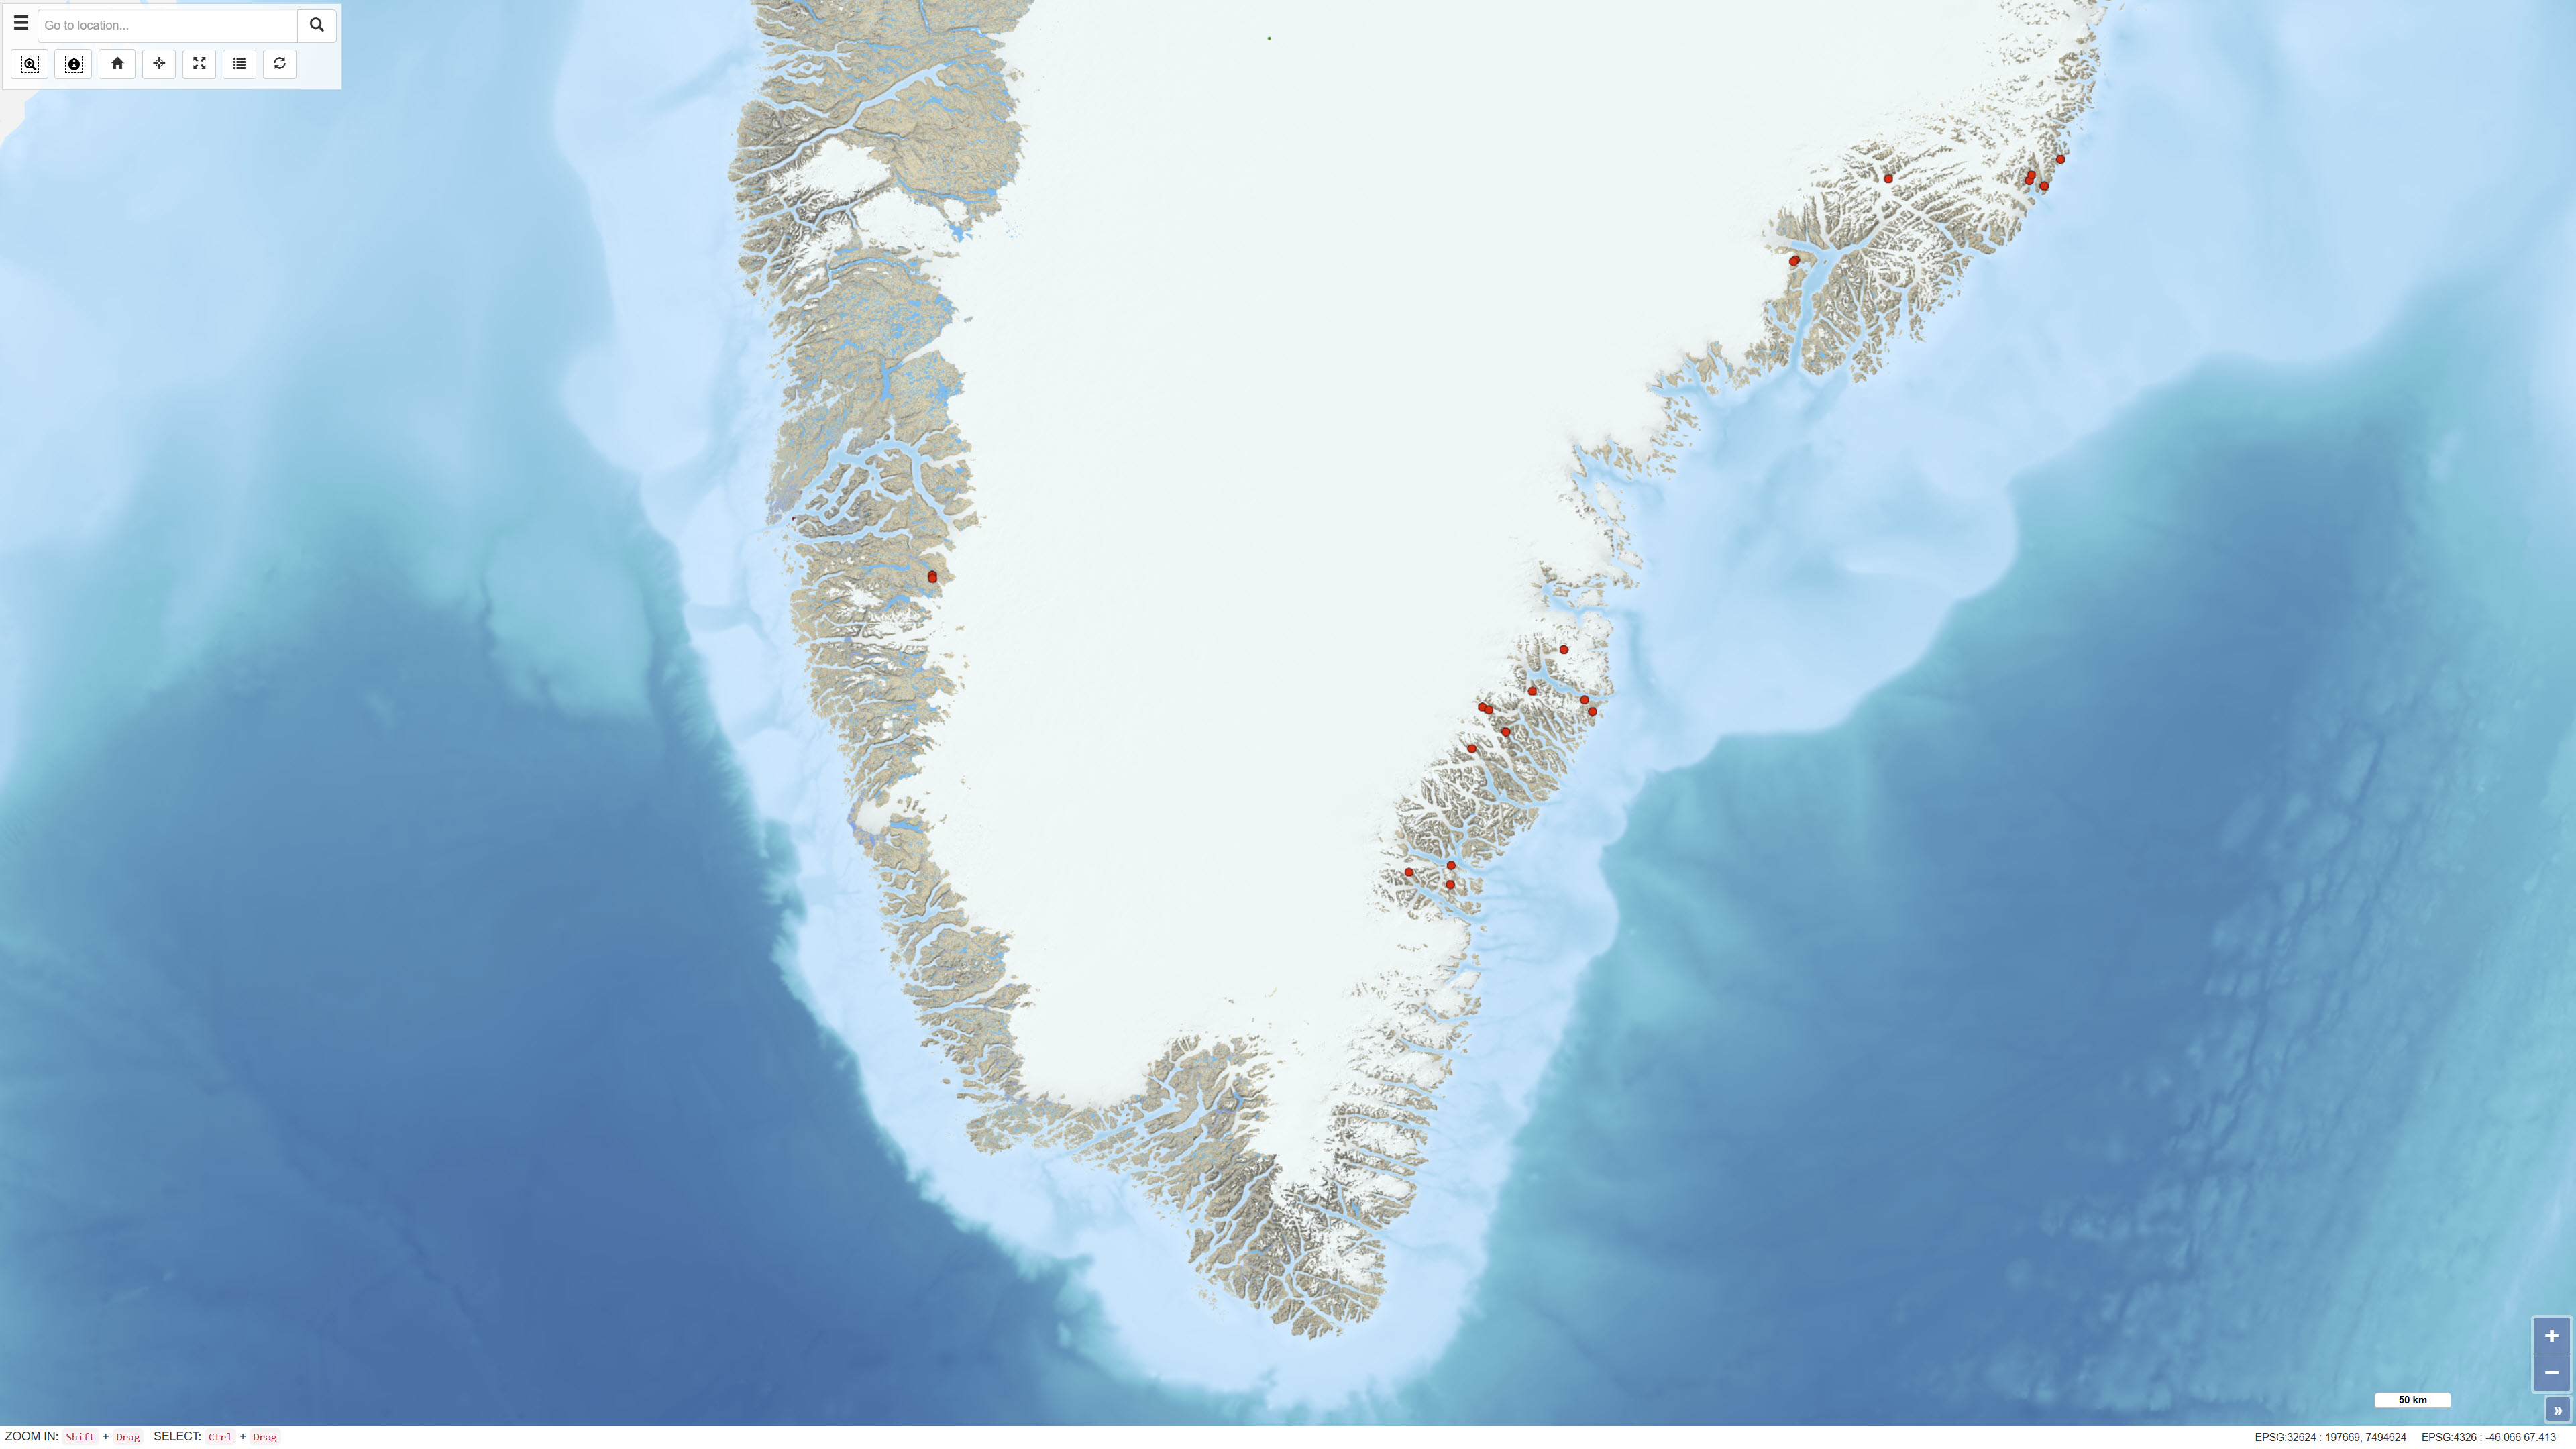
The dataset contains geochemical analyses of 49 scree (talus) samples collected in Greenland as part of regional geochemical mapping programmes conducted by the Geological Survey of Greenland (GGU), later GEUS, between 1977 and 1997. Scree samples were collected in areas where neither stream sediment nor soil sampling was feasible. The samples represent near-surface material derived from local bedrock and were analysed for major and trace elements using laboratory methods available at the time of collection. The dataset supplements regional geochemical data from stream sediment and soil samples and forms part of the overall basis for geochemical mapping in Greenland.
-
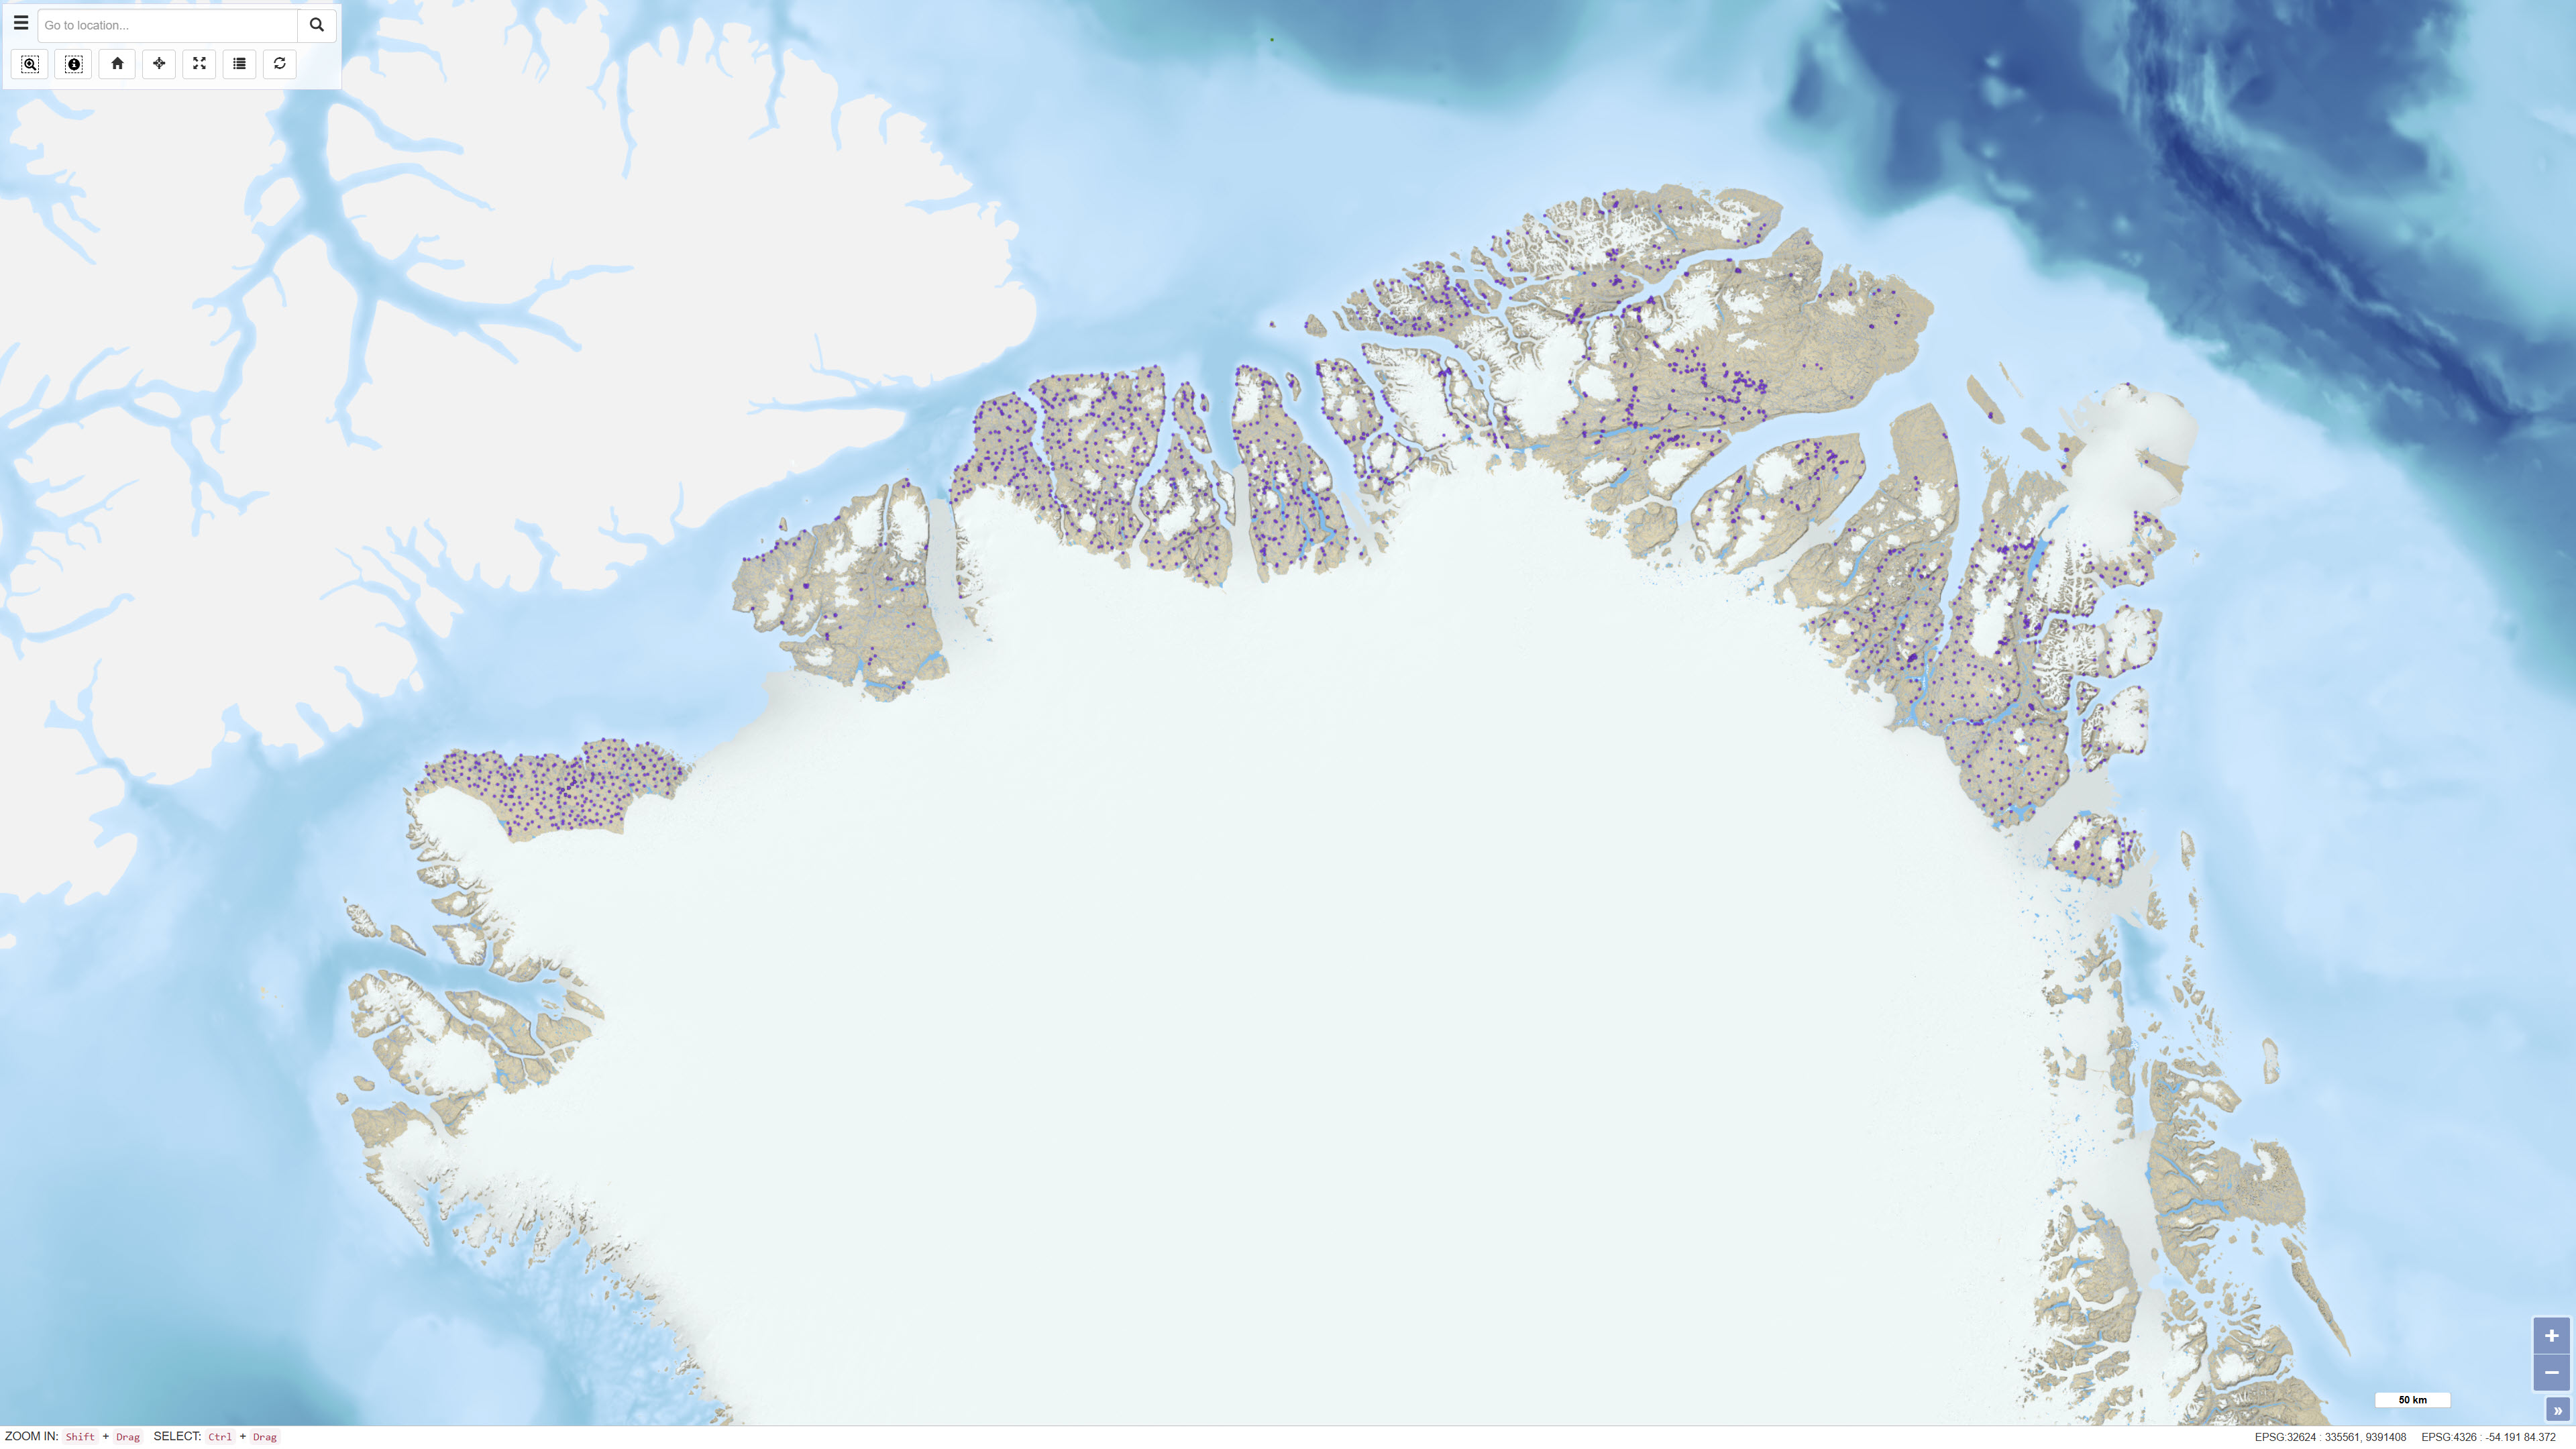
This dataset comprises calibrated geochemical data from stream sediment and soil samples collected in North Greenland between 1978 and 1999, supplemented by extensive reanalyses in 2011. The dataset includes selected elements relevant for the evaluation of zinc mineralisation: CaO, K₂O, Ba, Cu, Sr and Zn. A total of 2,469 stream sediment samples and 204 soil samples were included. The analytical values represent the most reliable results following systematic quality control and calibration procedures designed to eliminate bias between analytical methods and analytical periods, as described in Thrane et al. (2011). All values below detection limit are coded as 0 in the dataset. The dataset supports regional assessment of geochemical patterns and mineral potential in North Greenland.
-
Energy class layer produced by EMODnet Seabed Habitats as an input layer for the 2021 EUSeaMap broad-scale habitat model. The extent of the mapped area includes the Baltic Sea, and areas of the North Eastern Atlantic and Arctic extending from the Canary Islands in the south to Norway in the North. The map of energy classes was produced using underlying wave and current data and thresholds derived from statistical analyses or expert judgement on known conditions. This layer is the same as the input used in EUSeaMap 2019. A report on the methods used in the 2021 version of EUSeaMap (Vasquez et al., 2021) and reports on previous versions (v2016 and V2019) are linked in Online Resources.
-
Energy class layer produced by EMODnet Seabed Habitats as an input layer (habitat descriptor) for the 2025 EUSeaMap broad-scale habitat model. The extent of the mapped area includes the Baltic Sea, and areas of the North Eastern Atlantic and Arctic extending from the Canary Islands in the south to Norway in the North. The map of energy classes was produced using underlying wave and current data and thresholds derived from statistical analyses or expert judgement on known conditions. This layer was updated in EUSeaMap 2025 using a the wave Kinetic energy layer at the seabed layer for the European Shelf area used in 2023 (linked in the Online Resources). An accompanying confidence layer is available for viewing and download from EMODnet Seabed Habitats - metadata is linked in the 'Composed of' section below. A report on the methods used in the 2025 version of EUSeaMap will be added in due course, but reports on previous versions (v2016, v2019, v2021 and v2023) are available in the lineage. Credit: Licensed under CC-BY 4.0 from the European Marine Observation and Data Network (EMODnet) Seabed Habitats initiative (https://emodnet.ec.europa.eu/en/seabed-habitats), funded by the European Commission.
-
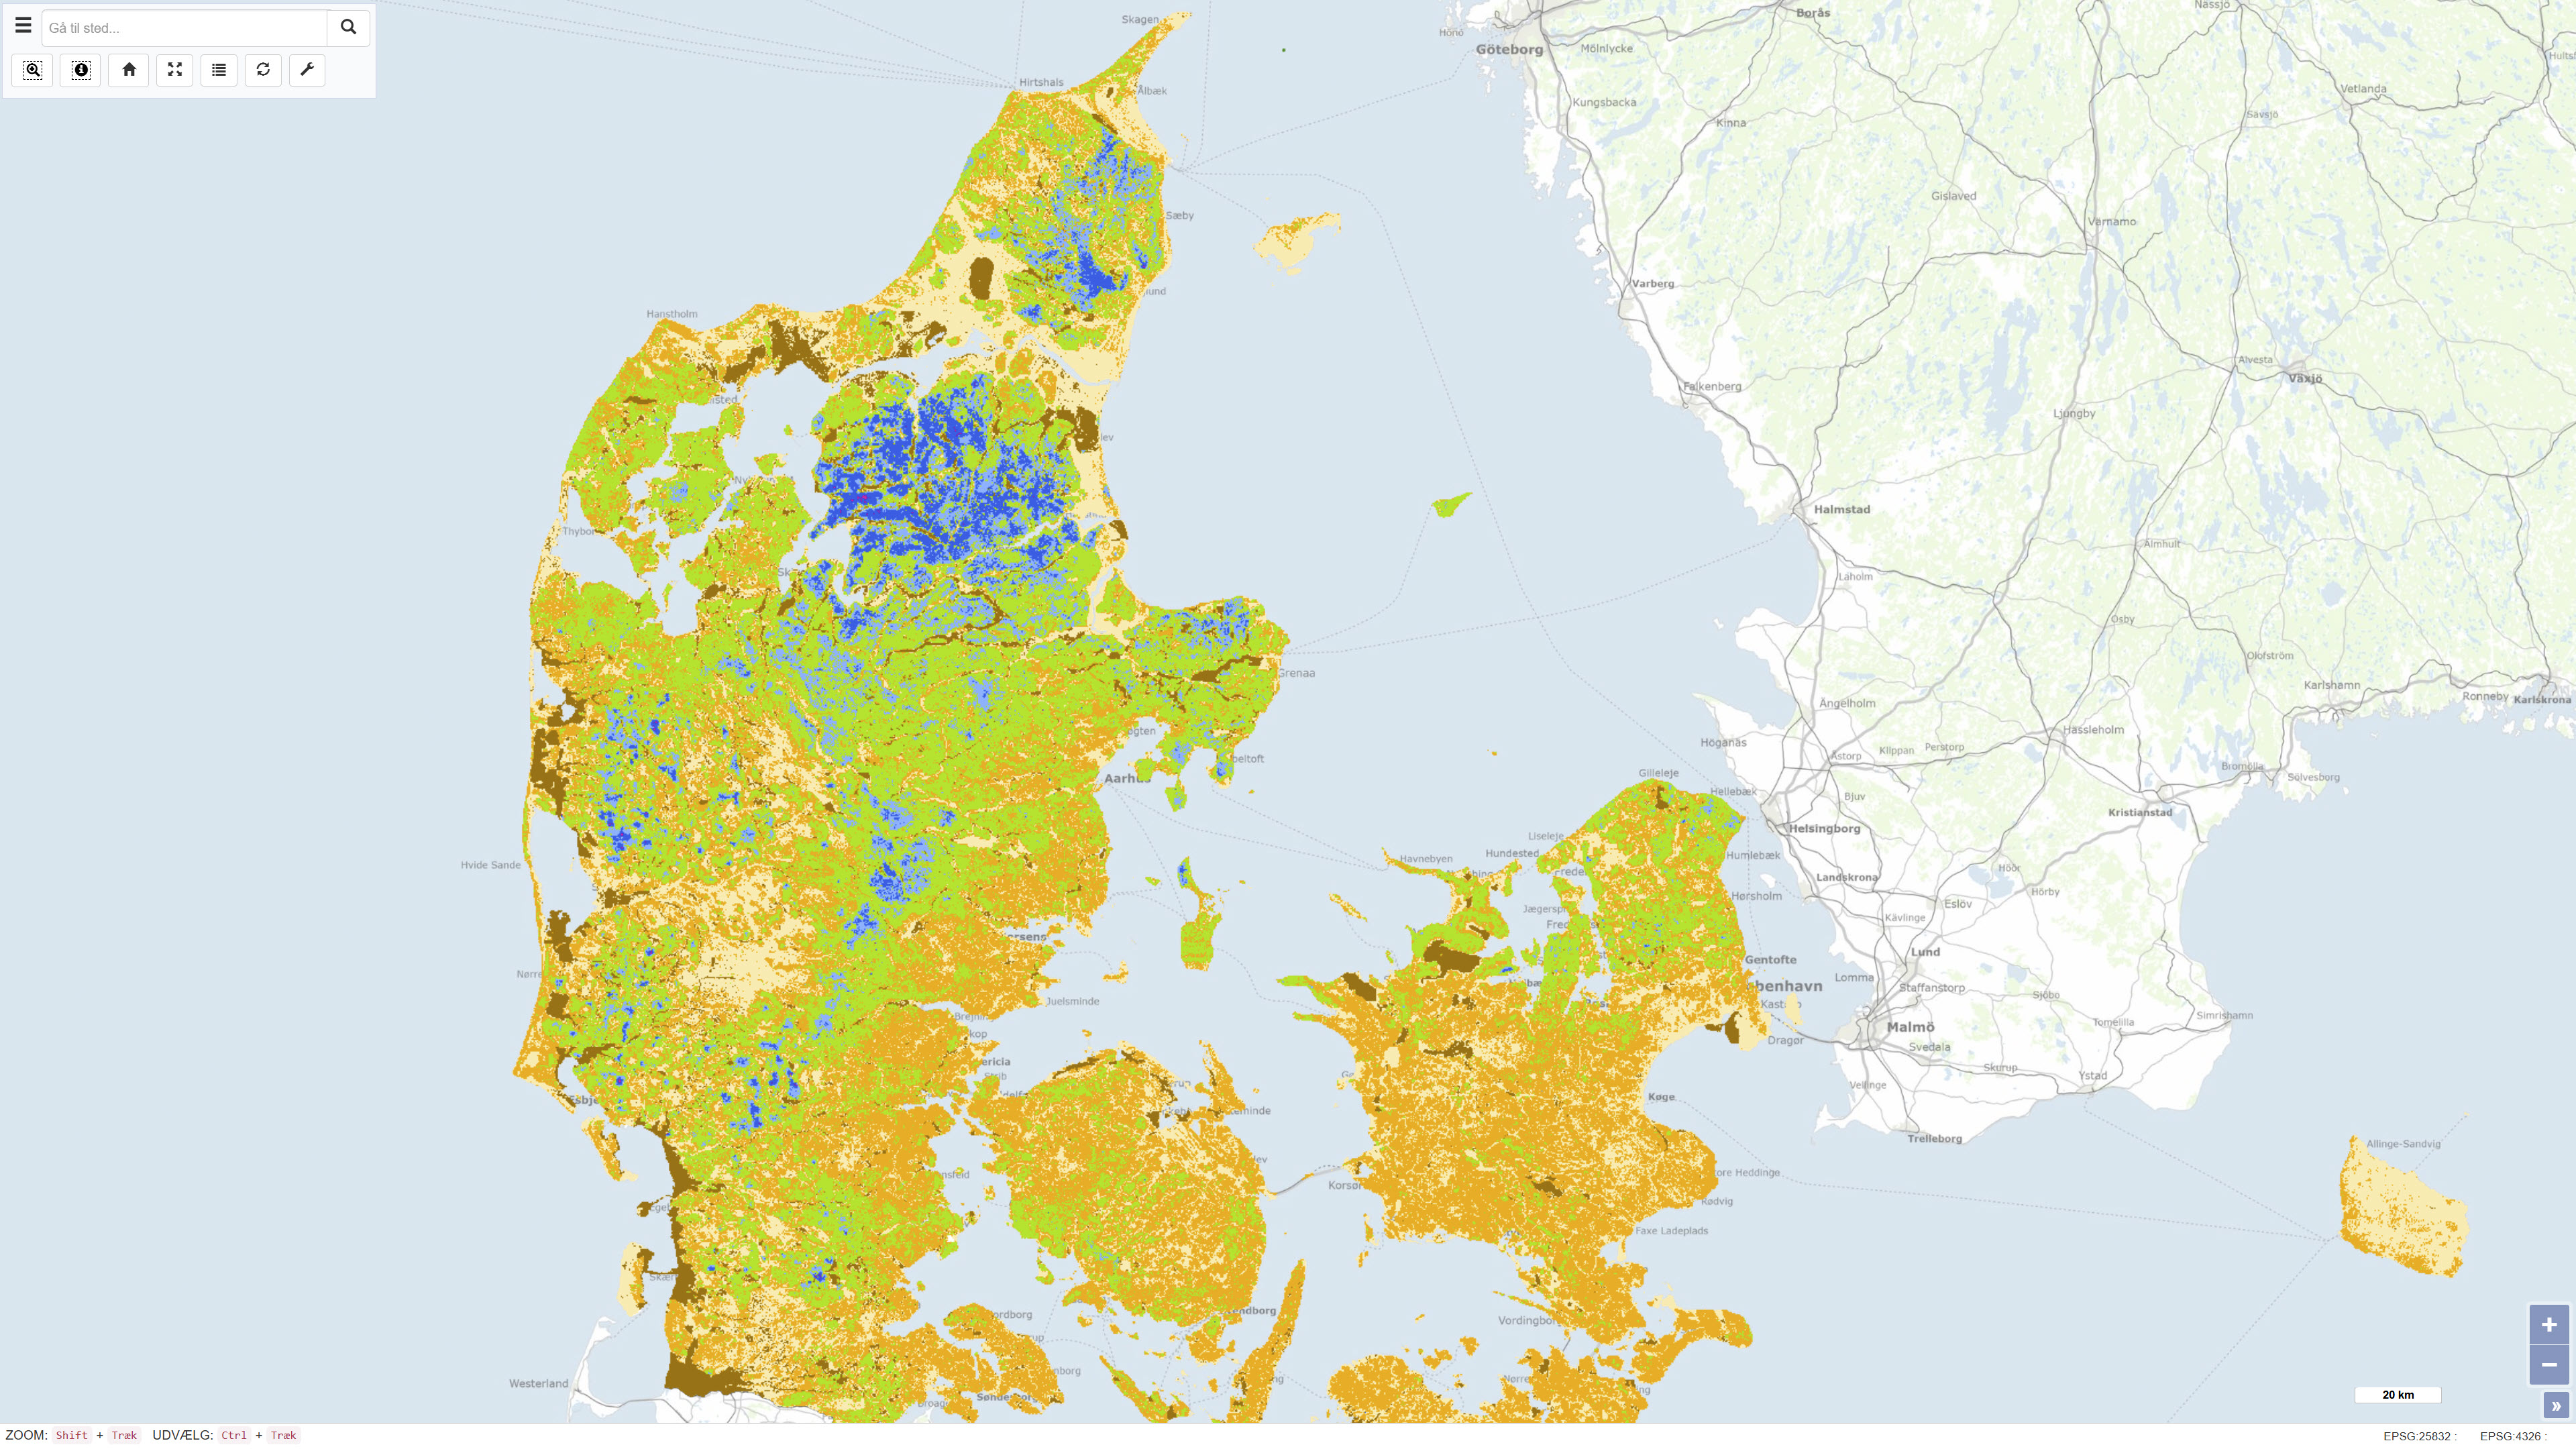
The dataset shows the depth to the redox interface in metres below ground level across Denmark at a spatial resolution of 100 metres. The redox interface represents the transition between oxidised and reduced sediment layers and is a key hydrogeological parameter influencing processes such as nitrate reduction and groundwater chemistry. The map is based on a statistical model developed from approximately 13.000 observations of colour changes in sediment samples and represents the best estimate of the depth to the redox interface nationwide. The dataset also includes an associated uncertainty estimate describing the variability and robustness of the model results.
-
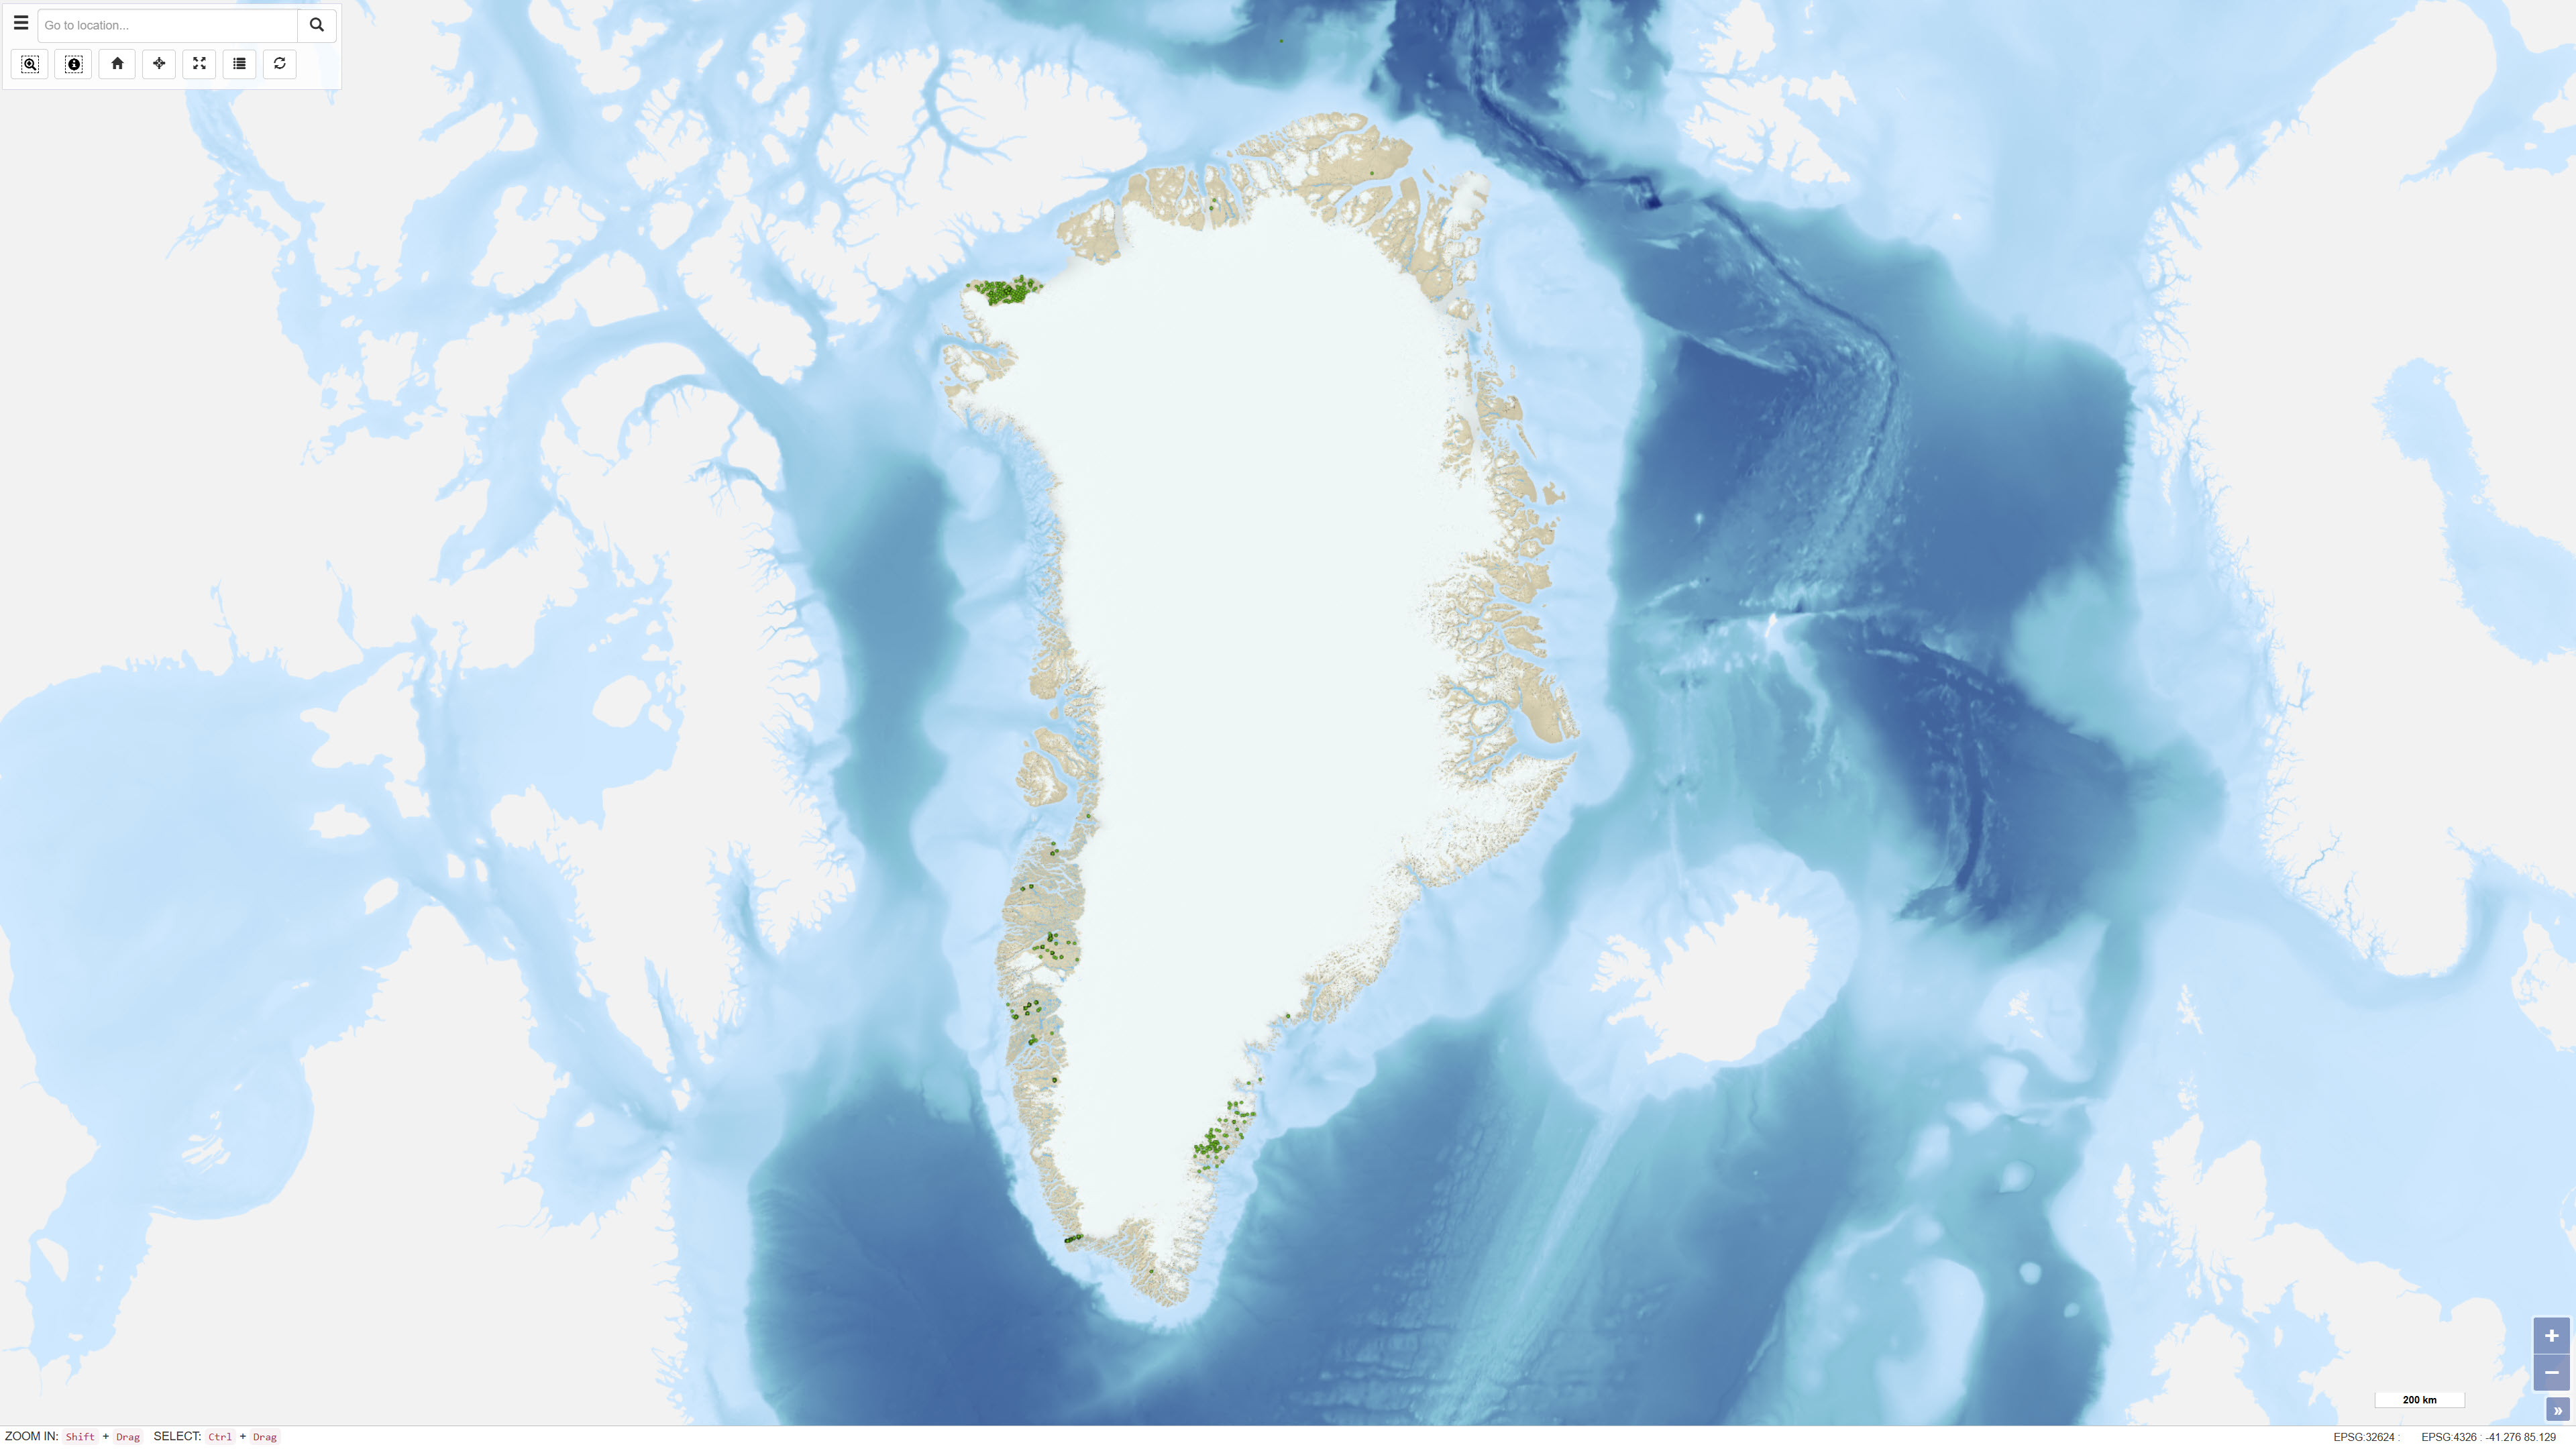
The dataset comprises geochemical analyses of 1,269 soil samples collected in Greenland from 1974 onwards as part of systematic geochemical mapping and mineral exploration programmes. Soil samples were primarily collected in areas lacking developed stream channels where stream sediment sampling was not feasible. The samples represent surface material and have been analysed for major and trace elements using various laboratory methods including X-ray Fluorescence Spectrometry (XRF), Instrumental Neutron Activation Analysis (INA), Inductively Coupled Plasma Emission Spectrometry (ICP), and Atomic Absorption Spectrometry (AAS). The dataset contains the original analytical results as received from the laboratories together with administrative information on sample location and analysed grain-size fraction. The data form part of the analytical basis for the Geochemical Atlas of West and South Greenland.
-
Layer showing the boundaries used to subset the modelling of EUSeaMap (2019) therefore streamlining the processing. Each region had a specific partner lead within the consortium: Celtic seas & Arctic - JNCC Iberian peninsula & Black Sea - Ifremer Baltic sea - GEUS Mediterranean - ISPRA
-

This group of maps, which includes the CanMatrix and CanTopo collections, is now a legacy product that is no longer maintained. It may not meet current government standards. Natural Resources Canada's (NRCan) topographic raster maps provide a representation of the topographic phenomena of the Canadian landmass. Several editions of paper maps have been produced over time in order to offer improved products compared to their predecessors in terms of quality and the most up to date information possible. The georeferenced maps can be used in a Geographic Information System (GIS). In all cases, they accurately represent the topographical data available for the date indicated (validity date). The combination of CanMatrix and CanTopo data provides complete national coverage. • CanMatrix - Print Ready: Raster maps produced by scanning topographic maps at scales from 1:25 000 to 1:1 000 000. This product is not georeferenced. Validity dates: 1944 to 2005 (1980 on average). Available formats: PDF and TIFF • CanMatrix - Georeferenced: Raster maps produced by scanning topographic maps at scales of 1:50 000 and 1:250 000. These maps are georeferenced according to the 1983 North American Reference System (NAD 83). Validity dates: 1944 to 2005 (1980 on average). Available format: GeoTIFF • CanTopo: Digital raster maps produced mainly from the GeoBase initiative, NRCan digital topographic data, and other sources. Approximately 2,234 datasets (maps) at scale of 1:50 000, primarily covering northern Canada, are available. CanTopo datasets in GeoPDF and GeoTIFF format are georeferenced according to the 1983 North American Reference System (NAD 83). Validity dates: 1946 to 2012 (2007 on average). Available formats: PDF, GeoPDF, TIFF and GeoTIFF
-
Arctic mask shapefile produced by EMODnet Seabed Habitats as an input layer for the 2021,2023 and 2025 EUSeaMap broad-scale habitat models. Used as a proxy to delimit the Arctic zone and it is used to classify shallow habitats into Arctic habitat classes as required by the EUNIS 2022 habitat classification. Details on the methods used to classify EUSM are present in the report linked in the Online Resources (Vasquez et al., 2021a). The masks covers areas in the Barents Sea which are North of the polar front or where ice concentration exceeded 20% on average in 2018. The 20% threshold was derived from WMO ice classification and corresponds to "Very open drift ice". Created by the EMODnet Seabed Habitats project consortium in 2021, and used in the 2023 and 2025 versions of EUSeaMap. No updates have been made to this layer. A report on the methods used to create the layer are in the 2021 version of EUSeaMap (Vasquez et al., 2021b) and reports on previous versions (v2019 and v2023) are linked in the lineage. A report on the methods used in the 2025 version of EUSeaMap will be added in due course. Credit: Licensed under CC-BY 4.0 from the European Marine Observation and Data Network (EMODnet) Seabed Habitats initiative (https://emodnet.ec.europa.eu/en/seabed-habitats), funded by the European Commission.
-
Shapefile showing areas where ice concentration in the Barents Sea in 2018 was on average more than 20%. The 20% threshold was derived from WMO ice classification and corresponds to "Very open drift ice". Data averaged by Ifremer and NIVA derived from CMEMS (Copernicus) ice concentration product (resolution 1km, temporal resolution 1 year- 2018). Used in EUSeaMap 2021 to create the Arctic mask layer as an input layer for the 2021 EUSeaMap broad-scale habitat model Created by the EMODnet Seabed Habitats project consortium. A report on the methods used in the 2021 version of EUSeaMap (Vasquez et al., 2021) and reports on previous versions (v2016 and V2019) are linked in Online Resources. Credit: Licensed under CC-BY 4.0 from the European Marine Observation and Data Network (EMODnet) Seabed Habitats initiative (www.emodnet-seabedhabitats.eu), funded by the European Commission.