Water
Type of resources
Available actions
Topics
Keywords
Contact for the resource
Provided by
Years
Formats
Representation types
Update frequencies
status
Service types
Scale
Resolution
-

The National Ecological Framework for Canada's "Land and Water Area by Province/Territory and Ecoprovince” dataset provides land and water area values by province or territory for the Ecoprovince framework polygon, in hectares. It includes codes and their English and French descriptions for a polygon’s province or territory, total area, land-only area and large water body area.
-

Mapping of linear watercourses in the territory of Quebec City.**This third party metadata element was translated using an automated translation tool (Amazon Translate).**
-

Mapping of open water courses located inside the islands of the Laval territory.**This third party metadata element was translated using an automated translation tool (Amazon Translate).**
-
This product provides runoff data with each contour line corresponding to an average amount of annual runoff (in millimeters). Runoff data were derived from discharge values from hydrometric stations with natural flows. Not all years are included for every region of the country due to data quality and availability issues. Data cover the period 1971 to 2013 for the south and 1971 to 2004 for the north. These files were produced by Statistics Canada, Environment, Energy and Transportation Statistics Division, 2017, based on data from Environment and Climate Change Canada, 2015, Water Survey of Canada, Archived Hydrometric Data (HYDAT), www.ec.gc.ca/rhc- wsc/default.asp?lang=En&n=4EED50F1-1 (accessed December 3, 2015); Spence, C. and A. Burke, 2008, “Estimates of Canadian Arctic Archipelago runoff from observed hydrometric data,” Journal of Hydrology, Vol. 362, pp. 247–259. For more information about methods, results and limitations see Appendix D in Statistics Canada, 2017, “Freshwater in Canada,” Human Activity and the Environment, Catalogue no. 16-201-X. The purpose of the dataset is to present runoff values as derived from Statistics Canada's Water Yield Model on a national scale map of 1:32,000,000. This product is intended to be used for reference or mapping purposes. The product ends at the shoreline of Canada as defined by the drainage region boundaries supplied for Map 1.1 Drainage regions of Canada. It does not include the Arctic Islands. Users are responsible for verifying that the product is appropriate for their intended application.
-

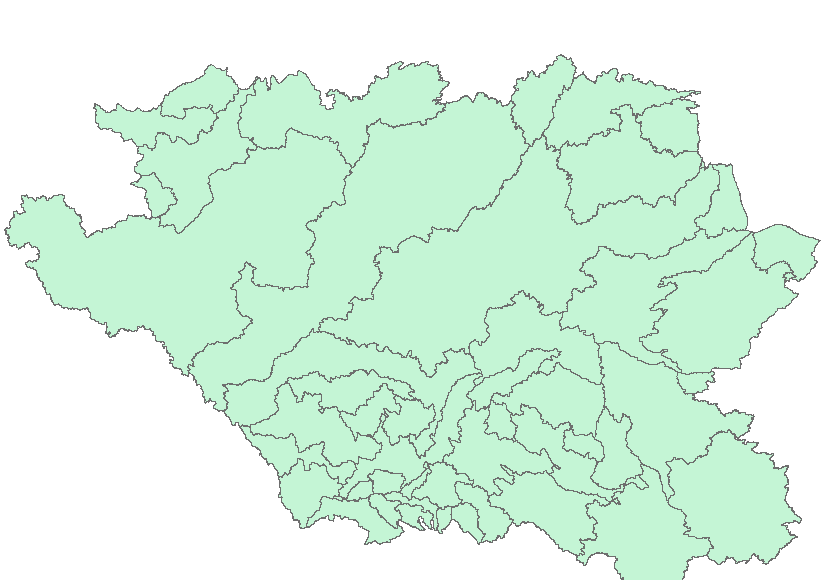
The “PFRA Sub-basins of the AAFC Watersheds Project – 2013” dataset is a geospatial data layer containing polygon features representing the 47 sub-basins within the Agriculture and Agri-Food Canada (AAFC) Watersheds Project, tailored for the Prairie Farm Rehabilitation Administration (PFRA) business needs.
-
The Agriculture and Agri-Food Canada's (AAFC) Watersheds Project level series supplies a number of watershed and watershed related datasets for the Prairie Provinces. The levels are greater or smaller assemblages of hydrometric areas, or the components defining them. The Project is organized by the hydrometric gauging station which are sourced from Environment Canada, the United States and Canadian provinces. Additional stations were generated to address structural issues, like river confluences or lake inlets. Collectively, they are referred to as the gauging stations, or simply, the stations. The drainage area that each station monitors, between itself and one or more of its upstream neighbours, is called an 'incremental gross drainage area'. The incremental gross drainage areas are collected into larger or smaller groupings based on size or defined interest to generate the various 'levels'of the series. For more information, visit: http://open.canada.ca/data/en/dataset/c20d97e7-60d8-4df8-8611-4d499a796493
-
This product provides runoff data with each contour line corresponding to an average amount of annual runoff (in millimeters). Runoff data were derived from discharge values from hydrometric stations with natural flows. Not all years are included for every region of the country due to data quality and availability issues. Data cover the period 1971 to 2013 for the south and 1971 to 2004 for the north. These files were produced by Statistics Canada, Environment, Energy and Transportation Statistics Division, 2017, based on data from Environment and Climate Change Canada, 2015, Water Survey of Canada, Archived Hydrometric Data (HYDAT), www.ec.gc.ca/rhc- wsc/default.asp?lang=En&n=4EED50F1-1 (accessed December 3, 2015); Spence, C. and A. Burke, 2008, “Estimates of Canadian Arctic Archipelago runoff from observed hydrometric data,” Journal of Hydrology, Vol. 362, pp. 247–259. For more information about methods, results and limitations see Appendix D in Statistics Canada, 2017, “Freshwater in Canada,” Human Activity and the Environment, Catalogue no. 16-201-X. The purpose of the dataset is to present runoff values as derived from Statistics Canada's Water Yield Model on a national scale map of 1:32,000,000. This product is intended to be used for reference or mapping purposes. The product ends at the shoreline of Canada as defined by the drainage region boundaries supplied for drainage regions of Canada. It does not include the Arctic Islands.
-

The "Effective Drainage Area of the AAFC Watersheds Project - 2013" dataset is a geospatial data layer containing polygon features representing the areas of the Agriculture and Agri-Food Canada's (AAFC) Watersheds Project that could, for the entire project areas, be expected to contribute to surface runoff under average runoff conditions.
-

The "Areas of Non-Contributing Drainage within Total Gross Drainage Areas of the AAFC Watersheds Project - 2013" dataset is a geospatial data layer containing polygon features representing the areas within the “total gross drainage areas” of each gauging station of the Agriculture and Agri-Food Canada (AAFC) Watersheds Project that DO NOT contribute to average runoff. A “total gross drainage area” is the maximum area that could contribute runoff for a single gauging station – the “areas of non-contributing drainage” are those parts of that “total gross drainage area” that DO NOT contribute to average runoff. For each “total gross drainage area” there can be none to several unconnected “areas of non-contributing drainage”. These polygons may overlap with those from other gauging stations’ “total gross drainage area”, as upstream land surfaces form part of multiple downstream gauging stations’ “total gross drainage areas”.
-

The “Incremental Gross Drainage Areas of the AAFC Watersheds Project - 2013” dataset is a geospatial data layer containing polygon features representing the incremental gross drainage areas of the Agriculture and Agri-Food Canada (AAFC) Watersheds Project. The Project area is subdivided by hydrometric gauging station. The maximum area that could contribute runoff to each station, less that of its upstream neighbour(s) is called an ‘incremental gross drainage area’.
 Arctic SDI catalogue