 Arctic SDI catalogue
Agriculture
Type of resources
Topics
Keywords
Contact for the resource
Provided by
Years
Formats
Representation types
Update frequencies
status
Service types
-

The “Biomass Agriculture Inventory 1-in-10 Probability” dataset is a table that contains the estimated 1-in-10 year low for agricultural residue yield and crop production for each Biomass Report Framework. It provides the tenth percentile values for the years 1985-2016. The table includes straw or stover information for barley, wheat, flax, oats and corn, and crop information for barley, wheat, flax, oats, corn, canola and soybean. This dataset also includes information about the type of tillage used in the area and demand for straw for cattle bedding and feed. These values are derived from Statistics Canada data. Additionally, the dataset includes the amount of agricultural residue calculated as necessary to remain on the field to prevent soil degradation. Soil degradation is determined by the type of tillage in use as well as the landscape of the area.
-
This dataset is no longer maintained by Agriculture and Agri-Food Canada and should be considered as an archived product. For current estimates of the agricultural extent in Canada please refer to the Agricultural Ecumeme produced by Statistics Canada. https://www150.statcan.gc.ca/n1/en/catalogue/92-639-X The Agriculture Extent of Canada derived from the AVHRR (Advanced Very High Resolution Radiometer) was obtained from the GeoGratis web site (www.geogratis.ca). All polygons with an area less than 50 Km sq were eliminated by GeoGratis before we received the data. This product allows the user to see the significant areas of cropland and rangeland across Canada. The Agriculture Extent of Canada derived from the AVHRR (Advanced Very High Resolution Radiometer) was obtained from the GeoGratis web site (www.geogratis.ca). All polygons with an area less than 50 Km sq were eliminated by GeoGratis before we received the data. This product allows the user to see the significant areas of cropland and rangeland across Canada.
-

The “Municipal Solid Waste Biomass Inventory” dataset is a stand-alone product that provides information on the calculated amount of Municipal Solid Waste within each BIMAT grid cell that includes a population centre. Data was provided by National Research Council Canada, with estimates based on census data collected in 2016. This dataset was calculated using an area-weighted analysis between population centres across Canada, Municipal Solid Waste data and the Biomass Report Framework fishnet. It includes information for total residential municipal solid waste, total organic waste (food and yard) and total paper waste.
-

The “Biomass Inventory Cartographic Layer” dataset provides the information that is used with the Biomass Report Framework to generate a visual representation of the availability of agricultural and forestry biomass and municipal solid waste in Canada. In addition to yield and production information for biomass produced by the agricultural and forestry industries, this dataset also provides information about the demand for agricultural residues for cattle feed and bedding, tillage systems currently in use on agricultural lands, and land suitability for hybrid poplar and willow plantations that are grown specifically to produce biomass. Agricultural information includes the median annual residue yield and available residue amounts. Residue yields were calculated using crop-to-residue ratios. The available residue information includes the amount that is available after adjusting for the estimated demand of straw used for cattle feed and bedding. Forestry estimates include average residue production, based on forestry activities including permitted amounts of harvesting, mills in operation and mill production. Municipal Solid Waste information includes organic waste (food and yard), paper waste and total residential municipal solid waste (which includes organic and paper waste, among others).
-
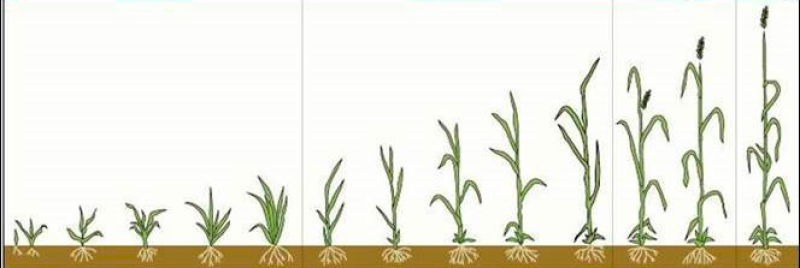
Crop development stage in a numerical scale. All living organisms move from one stage of development to the next over time. For annual crops, it life cycle (growing season) completed within a year. Crop water use differs from one stage to another mostly due to the differences in the amount of green leaves, thus crop stage is closely related to its water consumption and water stress condition. Crop stages are mostly controlled by growing season heat accumulation and regulated by day-length crop some crops. The crop stages provided here are determined by a biometeorlogical time scale model (Robertson, 1968) for cool season crops (wheat, barley etc.) , and a Crop Heat Unit (Brown and Bootsma, 1993) algorithm for warm season crops (corn and soybean etc.).
-
Cet ensemble de données est aligné sur une grille et comprend un ensemble de données sur les attributs des sols respectant les normes et les spécifications du projet GlobalSoilMap à des incréments de profondeur spécifiés. Il s'étend sur la partie agricole du Canada. Les polygones de cartes du PPC ont été rastérisés et combinés à la grille de la mission SRTM (Shuttle Radar Topography Mission) avec une grille de 90 mètres pour créer l'ensemble de données matricielles quadrillé. Des moyennes pondérées des attributs des sols sont générées à partir d'information existante sur l'horizon pédologique pour respecter les incréments de profondeur fixes reconnus. Les moyennes pondérées des attributs des sols sont calculées en utilisant toutes les composantes des sols à partir de leur superficie dans chaque polygone du PPC. Les moyennes pondérées des attributs des polygones sont représentées spatialement par la grille. Pour plus d'information, consulter : http://ouvert.canada.ca/data/fr/dataset/cb29b370-3639-4645-9ef9-b1ef131837b7
-
Les Silos à grains du Canada - jeu de données contient la liste des silos à grains au Canada telle qu'elle est communiquée par la Commission canadienne des grains (CCG). Les silos ont été localisés dans toute la mesure du possible selon leur emplacement réel, plutôt qu'une généralisation au point milieu du nom de la gare. De plus, l'information relative aux places de wagons du CN, du CP et des entreprises céréalières a été ajoutée lorsqu'elle a été publiée. Le présent jeu de données vise à offrir l'étendue temporelle et géographique des silos à grains au Canada. Pour plus d'information, consulter : http://ouvert.canada.ca/data/fr/dataset/05870f11-a52a-4bf4-bc15-910fd0b8a1a3
-
The impact of climatic variability on the environment is of great importance to the agricultural sector in Canada. Monitoring the impacts on water supplies, soil degradation and agricultural production is essential to the preparedness of the region in dealing with possible drought and other agroclimate risks. Derived normal climate data represent 30-year averages (1961-1990, 1971-2000, 1981-2010, 1991-2020) of climate conditions observed at a particular location. The derived normal climate data represents 30-year averages or “normals” for precipitation, temperature, growing degree days, crop heat units, frost, and dry spells. These normal trends are key to understanding agroclimate risks in Canada. These normal can be used as a baseline to compare against current conditions, and are particularly useful for monitoring drought risk.
-
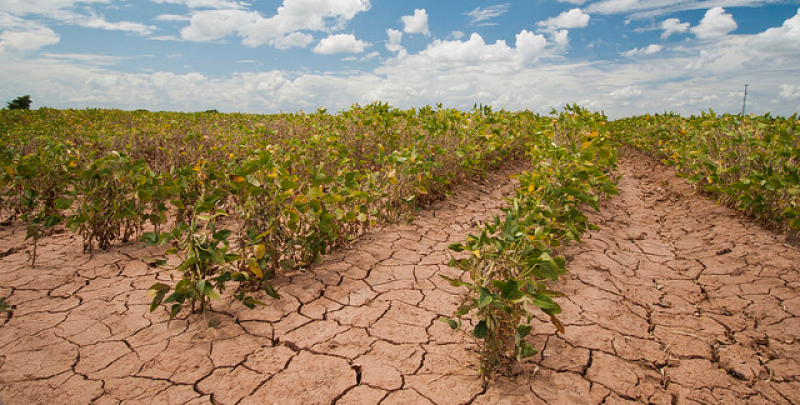
The Crop Stress Index is the ratio of actual evapotranspiration (AET) to potential evapotranspiration (PET) express as: CSI = 1-(AET/PET) AET and PET are calculated within the Versatile Soil Moisture Budget (VSMB) model using temperature and precipitation data and a crop-specific biometeorological time scale model to estimate growth stage (Robertson, 1968), with crop specific phenological and crop water extraction coefficients taken from Chipanshi et al 2013. The WDI ranges between 0 and 1, with a value closer to 1 indicating higher stress Crop Stress Index is modelled for each climate station using measured precipitation and temperature