 Arctic SDI catalogue
farming
Type of resources
Available actions
Topics
Keywords
Contact for the resource
Provided by
Years
Formats
Representation types
Update frequencies
status
Service types
Scale
Resolution
-
I produkten ingår två kartskikt som beskriver markfuktighet. Dessa rasterkartor är producerade genom sambearbetning av data från Lantmäteriets nationella laserskanning och provytor från Riksskogstaxeringen (SLU). Rastercellerna har en storlek på 2 x 2 meter. Värdena för en rastercell beskriver medel-markfuktigheten under året. Markfuktighetskartan bygger på hydrologiska modelleringar baserat på GSD-Höjddata grid 2+ © Lantmäteriet. Nedan följer en kort beskrivning av de variabler som ingår i produkten. SLU Markfuktighetskarta SLU markfuktighetskarta skapades genom att kombinera information i 24 olika kartor och använda fältdata från 20 000 av riksskogstaxeringens provytor som är fördelade över hela Sverige för att träna modellen (genom så kallad maskininlärning) var det är torrt och var det är blött. Det gör att kartan är anpassad för olika regioner med olika topografi, klimat, och jordarter. SLU markfuktighetskarta visar hur sannolikt det är att en pixel i kartan ska klassificeras som blöt, det kan ses som ett index där 0 är torr och 100 blöt. På SLU Markfuktighetskarta indikerar färgerna olika markfuktighet; torr mark är röd, fuktig mark är gul, frisk-fuktig mark är grön, fuktig mark är turkos och blöt mark är blå. Men färgerna på kartan ”smälter ihop” för att få mjukare övergångar. SLU Markfuktighetskarta klassad Den klassade markfuktighetskartan visar markfuktigheten indelad i tre klasser: 1. torr-frisk, 2. frisk-fuktig och 3. fuktig-blöt. Öppet vatten (sjöar och vattendrag) har klassats som 4. Läs mer om de enskilda rasterkartorna på http://www.slu.se/mfk.
-
Scannade ÖSI-kartor från Skogsstyrelsens Översiktliga Skoglig Inventering. Inventering i fält samt kartritning vid ritbord 1982-1993.
-
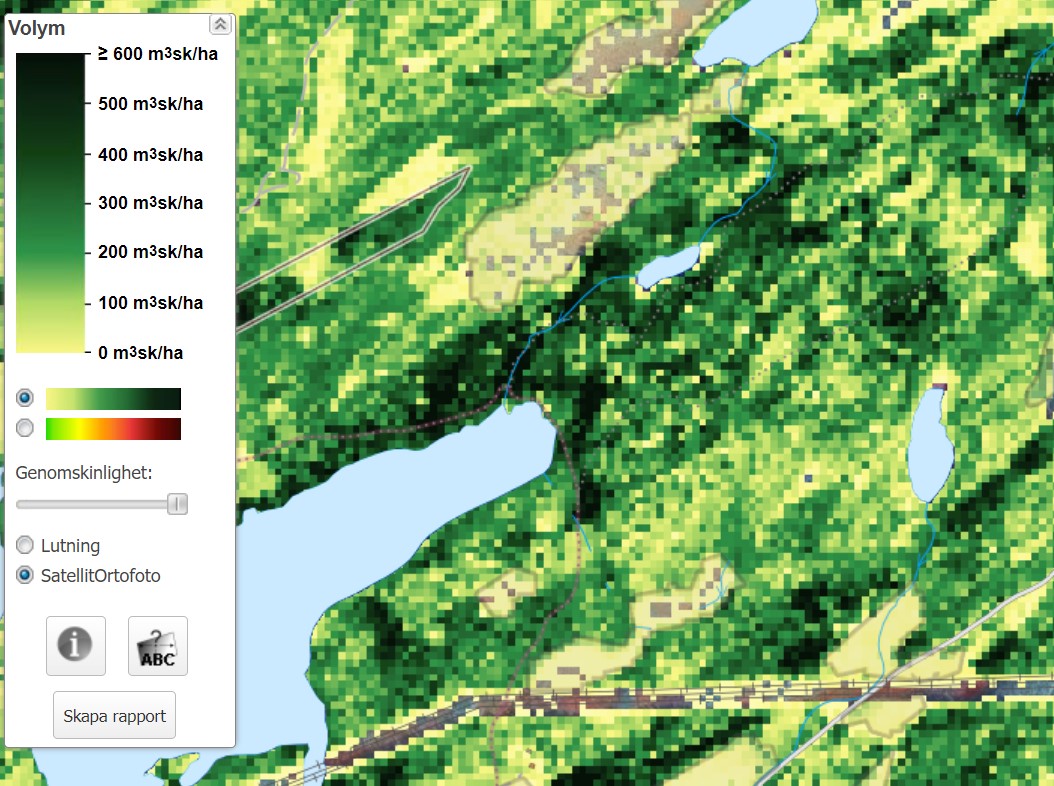
Skogliga grunddata består av ett antal olika kartprodukter producerade genom sambearbetning av data från Lantmäteriets nationella laserskanning och provytor från SLU:s Riksskogstaxering. I skogliga grunddata finns information om: Volym (enhet: m3sk/hektar) Grundytevägd medelhöjd (Hgv) (enhet dm) Grundyta (Gy) (enhet: cm) Grundytevägd medeldiameter (Dgv) (enhet: cm) Biomassa (enhet: ton torrsubstans/hektar)
-
Områden som avverkats enligt skillnadsanalys i satellitbilder.
-

The “Municipal Solid Waste Biomass Inventory” dataset is a stand-alone product that provides information on the calculated amount of Municipal Solid Waste within each BIMAT grid cell that includes a population centre. Data was provided by National Research Council Canada, with estimates based on census data collected in 2016. This dataset was calculated using an area-weighted analysis between population centres across Canada, Municipal Solid Waste data and the Biomass Report Framework fishnet. It includes information for total residential municipal solid waste, total organic waste (food and yard) and total paper waste.
-
This dataset is no longer maintained by Agriculture and Agri-Food Canada and should be considered as an archived product. For current estimates of the agricultural extent in Canada please refer to the Agricultural Ecumeme produced by Statistics Canada. https://www150.statcan.gc.ca/n1/en/catalogue/92-639-X The Agriculture Extent of Canada derived from the AVHRR (Advanced Very High Resolution Radiometer) was obtained from the GeoGratis web site (www.geogratis.ca). All polygons with an area less than 50 Km sq were eliminated by GeoGratis before we received the data. This product allows the user to see the significant areas of cropland and rangeland across Canada. The Agriculture Extent of Canada derived from the AVHRR (Advanced Very High Resolution Radiometer) was obtained from the GeoGratis web site (www.geogratis.ca). All polygons with an area less than 50 Km sq were eliminated by GeoGratis before we received the data. This product allows the user to see the significant areas of cropland and rangeland across Canada.
-

The “Biomass Inventory Cartographic Layer” dataset provides the information that is used with the Biomass Report Framework to generate a visual representation of the availability of agricultural and forestry biomass and municipal solid waste in Canada. In addition to yield and production information for biomass produced by the agricultural and forestry industries, this dataset also provides information about the demand for agricultural residues for cattle feed and bedding, tillage systems currently in use on agricultural lands, and land suitability for hybrid poplar and willow plantations that are grown specifically to produce biomass. Agricultural information includes the median annual residue yield and available residue amounts. Residue yields were calculated using crop-to-residue ratios. The available residue information includes the amount that is available after adjusting for the estimated demand of straw used for cattle feed and bedding. Forestry estimates include average residue production, based on forestry activities including permitted amounts of harvesting, mills in operation and mill production. Municipal Solid Waste information includes organic waste (food and yard), paper waste and total residential municipal solid waste (which includes organic and paper waste, among others).
-

The Census of Agriculture is disseminated by Statistics Canada's standard geographic units (boundaries). Since these census units do not reflect or correspond with biophysical landscape units (such as ecological regions, soil landscapes or drainage areas), Agriculture and Agri-Food Canada in collaboration with Statistics Canada's Agriculture Division, have developed a process for interpolating (reallocating or proportioning) Census of Agriculture information from census polygon-based units to biophysical polygon-based units. In the “Interpolated census of agriculture”, suppression confidentiality procedures were applied by Statistics Canada to the custom tabulations to prevent the possibility of associating statistical data with any specific identifiable agricultural operation or individual. Confidentiality flags are denoted where "-1" appears in data cell. This indicates information has been suppressed by Statistics Canada to protect confidentiality. Null values/cells simply indicate no data is reported.