 Arctic SDI catalogue
SHP
Type of resources
Available actions
Topics
Keywords
Contact for the resource
Provided by
Years
Formats
Representation types
Update frequencies
status
Scale
Resolution
-

CanCoast is a geospatial database of the physical characteristics of Canada's marine coasts. It includes both feature classes that are not expected to change through time, and feature classes that are expected to change as climate changes. CanCoast includes: wave-height change with sea ice (early and late 21st century); sea-level change (early and late century); ground ice content; coastal materials; tidal range; and backshore slope. These are mapped to a common high-resolution shoreline and used to calculate indices that show the coastal sensitivity of Canada's marine coasts in modelled early and late 21st century climates.
-

This project was completed by the Salmonids Section in the Newfoundland and Labrador Science Branch of Fisheries and Oceans Canada (DFO). The Coastal Environmental Baseline Program has supported efforts in 2018 and 2019 of tagged Atlantic salmon smolts leaving the Bay de L’eau River and Rushoon River region of Placentia Bay. This was part of a larger four year tracking study in this region (2018, 2019, 2021, 2022) trying to improve DFO’s understanding of the residency, survival, and migration routes of Atlantic salmon smolts during the first months at sea within northwest Placentia Bay. As of spring 2023, four years of detection data were being processed with the goal of presenting this work at the next Atlantic salmon CSAS meeting and developing a primary publication. This record contains the locations there smolt were tagged in Placentia Bay, NL.
-
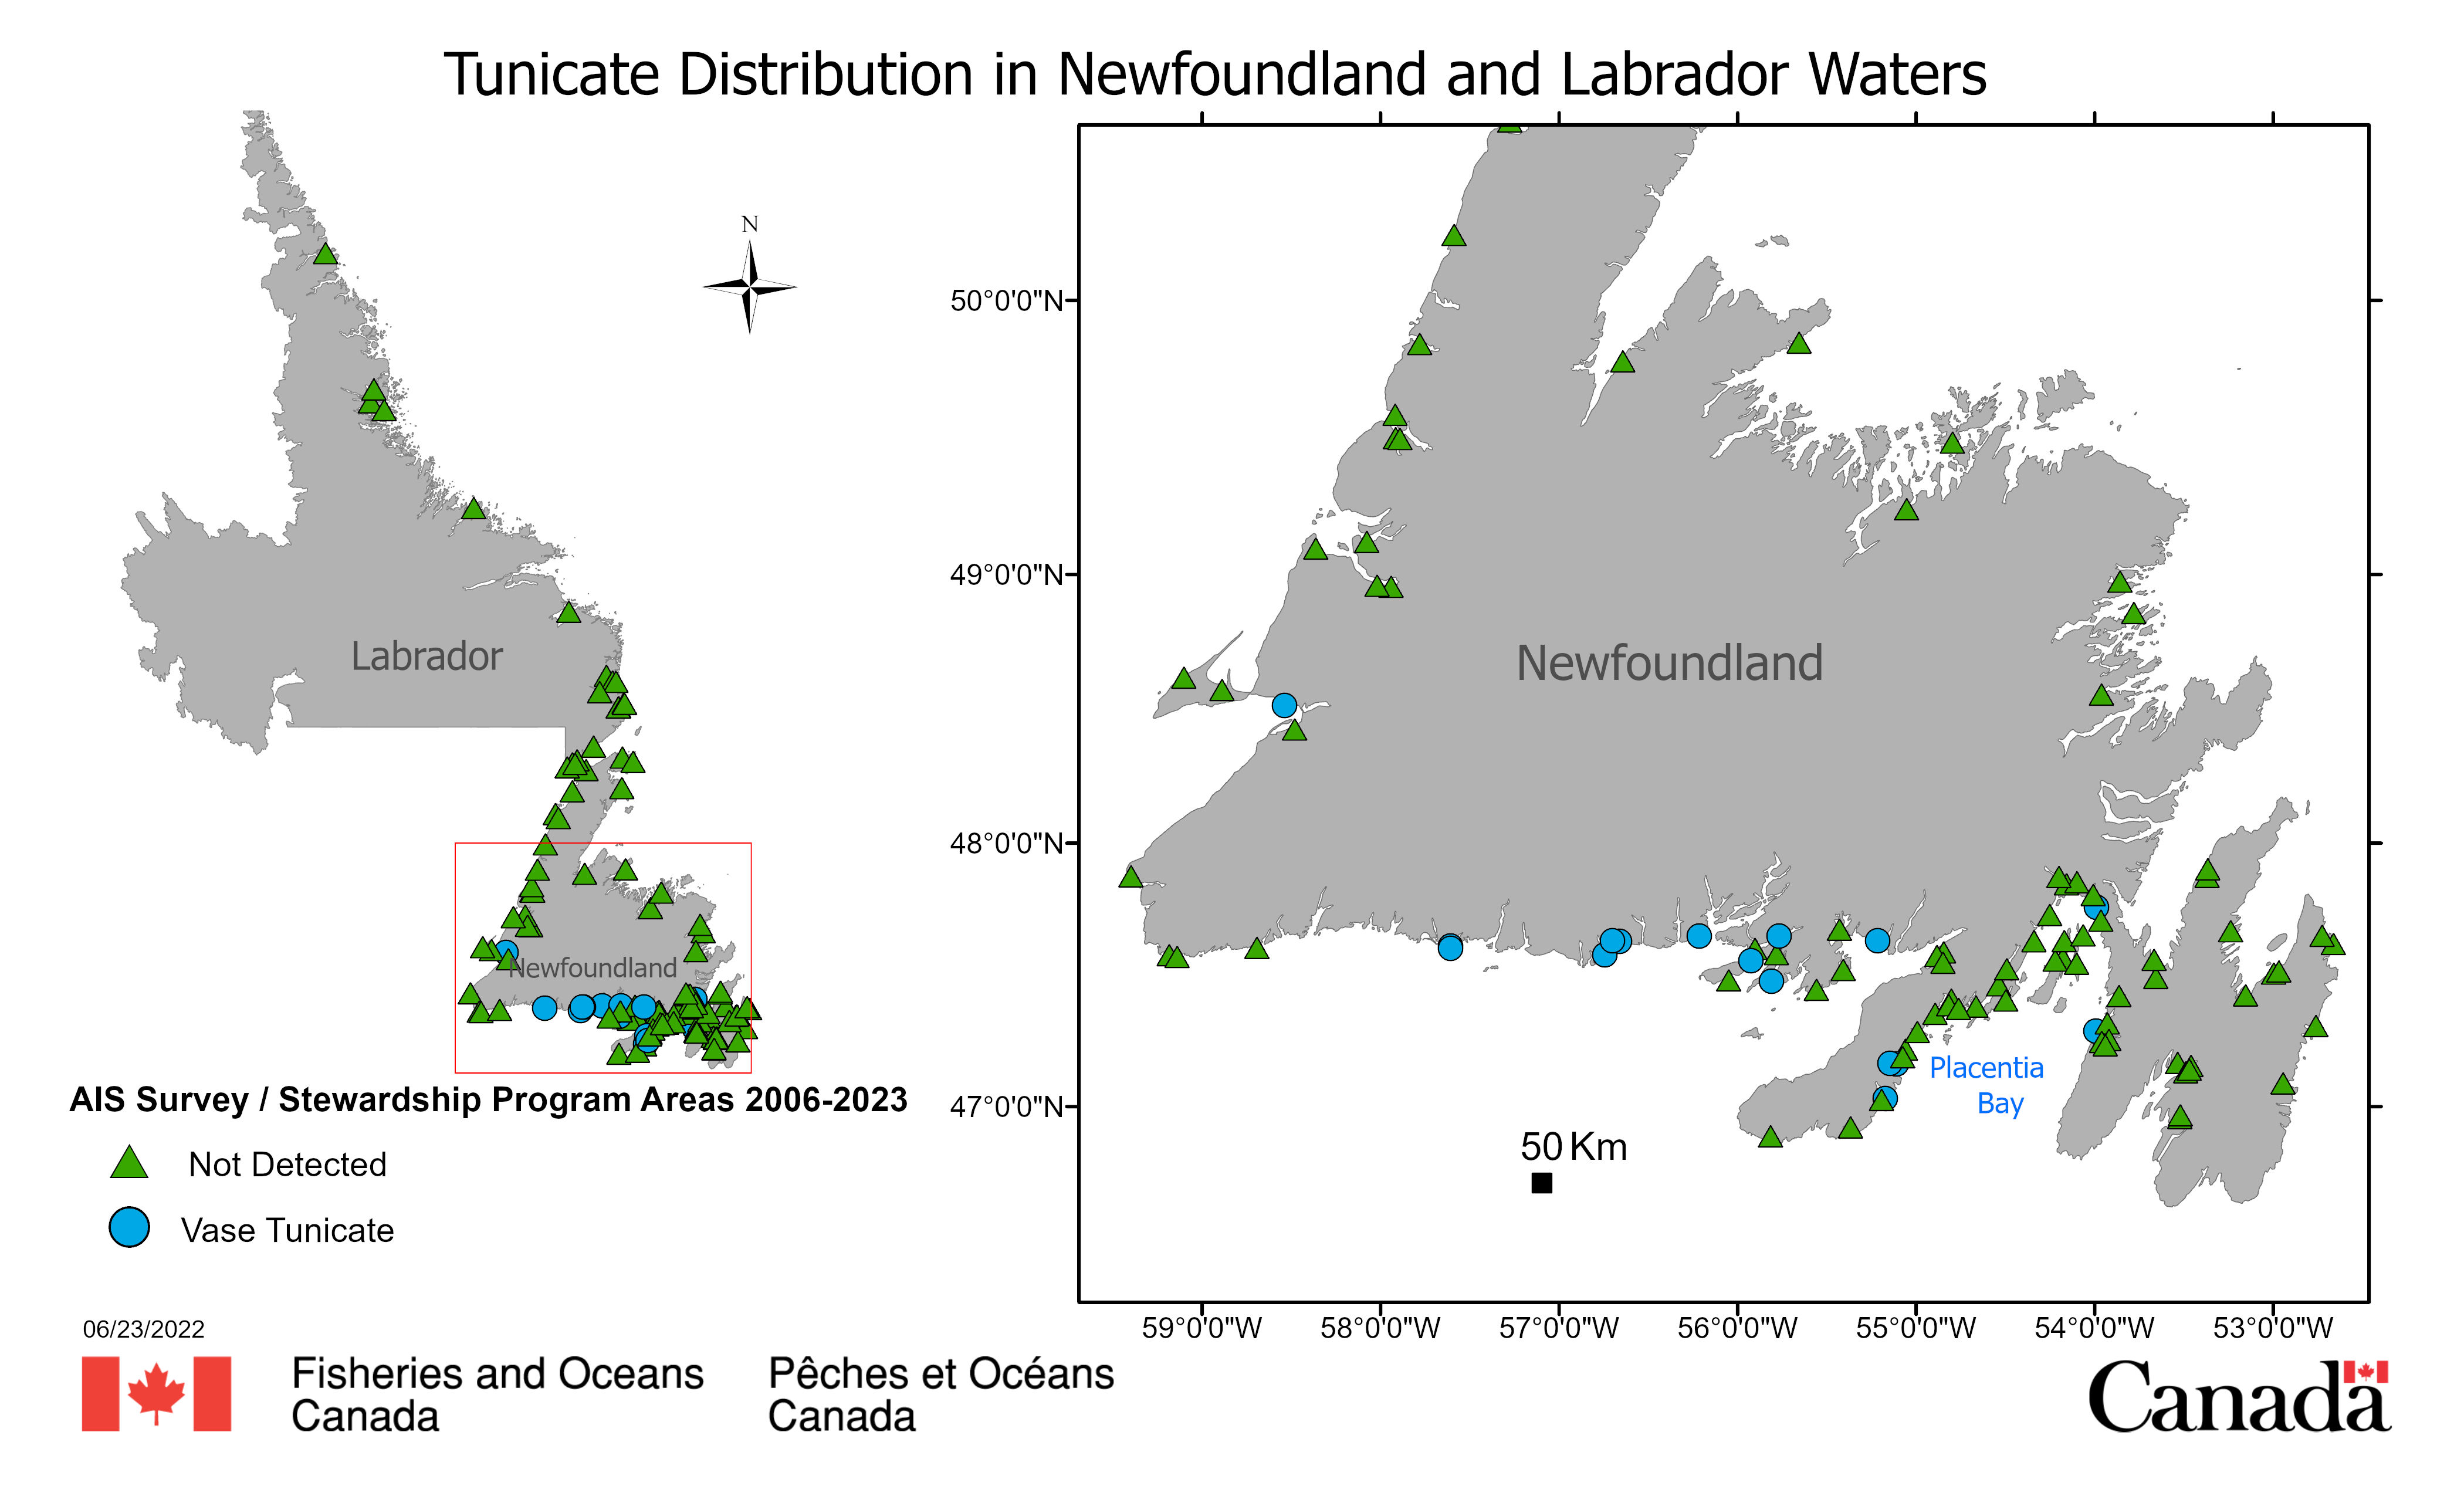
AIS NL Biofouling Species Fisheries and Oceans Canada's (DFO) National Marine Biofouling Monitoring Program conducts annual field surveys to monitor the introduction, establishment, spread, species richness, and relative abundance of native and some non-native species in Newfoundland and Labrador (NL) Region since 2006. Standardized monitoring protocols employed by DFO's NL, Maritimes, Gulf, and Quebec regions include biofouling collector plates deployed from May to October at georeferenced intertidal and shallow subtidal sites, including public docks, and public and private marinas and nautical clubs. Initially, (2006-2017), the collectors consisted of three 10 cm by 10 cm PVC plates deployed in a vertical array and spaced approximately 40 cm apart, with the shallowest plate suspended at least 1 m below the surface to sample subtidal and shallow intertidal species (McKenzie et al 2016a). Three replicate arrays were deployed at least 5 m apart per site. Since 2018, collector networks have been modified to improve statistical replication, including up to 10 individual collectors deployed per site at 1 m depth and at least 5 m apart (as above) from May to October. Since 2006, seven invasive biofouling organisms have been detected in Newfoundland and Labrador harbours, marinas and coastal areas. Should be cited as follows: DFO Newfoundland and Labrador Region Aquatic Invasive Species Marine Biofouling Monitoring Program. Published March 2024. Coastal and Freshwater Ecology, Northwest Atlantic Fisheries Centre, Fisheries and Oceans Canada, St. John’s, Newfoundland and Labrador. Reference: Tunicates Vase tunicate (Ciona intestinalis) 2012 The Vase tunicate, is a high impact solitary invader and was first detected by DFO in 2012 on the Burin Peninsula at Ship Cove and Little Bay, Placentia Bay. Various mitigation measures (McKenzie et al. 2016b) contained this invasive tunicate to a small area for six years within Placentia Bay. First detected in Fortune Bay as an established population in 2019, increasing reports of the Vase tunicate have been made along the south coast of Newfoundland. The data provided here indicates the detections of this AIS in coastal NL. From 2018-2022, the Coastal Environmental Baseline Program provided additional support to enhance sampling efforts in Placentia Bay.
-

This project was completed by the Groundfish Section in the Newfoundland and Labrador Science Branch of Fisheries and Oceans Canada (DFO). From 2018 to 2020, 14 year-round, acoustic receivers were deployed in Placentia Bay as a part of the Coastal Environmental Baseline Program to form 4 gates: Bar Haven (2 receivers), Centre Channel (1 receiver), Eastern Channel (6 receivers), and Western Channel (5 receivers). Additionally, 162 transmitters were deployed in Atlantic cod in the 3Ps region (2019-2022). Over the deployment period these receivers recorded a total of 2 094 024 detections from 63 unique transmitters including 45 Cod tagged through the Groundfish acoustic telemetry program. Most cod detected were tagged in Placentia Bay (43 fish) and many were detected at multiple receivers or multiple years (37 fish). Passive data collection for this project may extend up to 2030. This record contains the locations of the acoustic receivers in Placentia Bay, NL.
-
This project was completed by the Coastal Environmental Baseline Program (Coastal and Freshwater Ecology Section) in the Newfoundland and Labrador Science Branch of Fisheries and Oceans Canada (DFO). From 2018 to 2022 baseline biological and physical data were collected in Placentia Bay using Atlantic Zone Monitoring Program (AZMP) and Cold Ocean Productivity Experiment (COPE) protocols. Complementary data were collected in the bay using moored CTDs. Where possible, sampling was conducted monthly at 4 sites between May and November to capture broad scale spatial and temporal trends. Additionally, data were collected bi-weekly in April and May, and monthly from June to September at one of these sites to capture finer scale temporal trends, such as spring blooms, in collaboration with Dr. C. McKenzie. Phytoplankton were collected using vertical net tows and niskins. Zooplankton were collected using vertical net tows. CTDs were used to collect physical and biogeochemical water column data including temperature, pressure, salinity, depth, chlorophyll-a, turbidity, dissolved oxygen, pH, photosynthetic active radiation (PAR), fluorescent dissolved organic matter (FDOM), and conductivity. Water biogeochemistry data were obtained by collecting water samples with niskins at depths of 5, 10, 20, 30, 40m, and 10m above bottom to measure nutrients, chlorophyll-a, carbonates, and particulate organic carbon and nitrogen (POC/PON). Additionally, eDNA samples were taken at each of the 4 sampling sites. This record contains the geographic locations of the sites, and information on the timing and type of data collected at each site.
-

CanCoast is a geospatial database of the physical characteristics of Canada's marine coasts. It includes both feature classes that are not expected to change through time, and feature classes that are expected to change as climate changes. CanCoast includes: wave-height change with sea ice (early and late 21st century); sea-level change (early and late century); ground ice content; coastal materials; tidal range; and backshore slope. These are mapped to a common high-resolution shoreline and used to calculate indices that show the coastal sensitivity of Canada's marine coasts in modelled early and late 21st century climates.
-

This project was completed by the Coastal Environmental Baseline Program (Coastal and Freshwater Ecology Section) in the Newfoundland and Labrador Science Branch of Fisheries and Oceans Canada (DFO). From 2020-2023, there were semi-annual deployments and retrievals of 3 moored CTDs in the bay. From 2020 to November 2021, moored CTDs collected hourly recordings of conductivity, temperature and pressure. From 2021 through 2023, these CTDs collected year-round, hourly, information on temperature, conductivity, pressure, dissolved oxygen, and chlorophyll-a. Acoustic releases also collected hourly ambient noise (mV) data. This record contains the geographic locations of the sites, and information on the timings and types of data collected at each site.
-

This project was completed by the Shellfish Section in the Newfoundland and Labrador Science Branch of Fisheries and Oceans Canada (DFO), in collaboration with industry partners. The Coastal Environmental Baseline program supported the Placentia Bay portion of project work for an ongoing industry-DFO collaborative post-season trap survey for Snow Crab that was initiated in 2003 and has occurred each year. This survey is conducted by Snow Crab harvesters accompanied by at-sea observers and takes place in NAFO Divisions 2J3KLNOP4R. Historically the survey focused on commercial fishing grounds but began transitioning to a partly random stratified design in 2017. Since 2018, approximately 50% of survey stations are randomly allocated while 50% remain fixed. At each station, six (for inshore stations) or ten (for offshore stations) commercial traps are set in a fleet. To gather data on non-commercial sized Snow Crab, including females, many fleets also include one small-mesh trap. The coverage of small-mesh traps has been expanding in recent years with the aim of one small-mesh trap for every station in the coming years. Biological sampling is undertaken on at least one commercial trap and the small-mesh trap at each station. The data from this survey is incorporated into the annual stock assessment for Snow Crab in the Newfoundland and Labrador region. This record contains trap locations for Placentia Bay, and information on the types of data collected. More detailed information can be found in Pantin et al. (2022). https://publications.gc.ca/collections/collection_2023/mpo-dfo/fs70-5/Fs70-5-2022-076-eng.pdf
-

CanCoast is a geospatial database of the physical characteristics of Canada's marine coasts. It includes both feature classes that are not expected to change through time, and feature classes that are expected to change as climate changes. CanCoast includes: wave-height change with sea ice (early and late 21st century); sea-level change (early and late century); ground ice content; coastal materials; tidal range; and backshore slope. These are mapped to a common high-resolution shoreline and used to calculate indices that show the coastal sensitivity of Canada's marine coasts in modelled early and late 21st century climates.
-

The data in this dataset represent an amalgamation of sea turtle sighting, stranding, and entrapment events, mainly near Newfoundland and Labrador (NL), Canada. This document summarises the detection events data for Leatherback (Dermochelys coriacea), Loggerhead (Caretta caretta), and Green (Chelonia mydas) Turtles that has been collected from opportunistic and systematic survey sources, plus stranding and entrapment records, in the waters of NL from 1946 to 2023. To a much lesser extent there are also detection records for the southern Gulf of St. Lawrence. Scotian Shelf, and northeastern U.S. waters. These detection records are mostly derived from opportunistic reports, so there are rarely data for a report that includes measures of the observer effort expended to make the detection, and rarely associated imagery. During DFO aerial surveys there are measures of effort in most cases, enabling the turtle sightings reports to be used in habitat modelling (e.g., Mosnier et al. 2018). Most of the information variables (such as “Date”, “Latitude”, “Longitude”, “Number of Animals”) have been obtained from the detection report. In some cases data for variables such as “Location Reliability”, “ID Reliability”, “Platform”, and “Strand or Entrapment Outcome” were derived from interpretation of the comments associated with the report, if available. For description of the variables in the dataset see the Data Dictionary. References: Mosnier, A., Gosselin, J.-F., Lawson, J., Plourde, S., and Lesage, V. 2018. Predicting seasonal occurrence of leatherback turtles (Dermochelys coriacea) in eastern Canadian waters from turtle and sunfish (Mola mola) sighting data and habitat characteristics. Can. J. Zool. 97: 464-478. https://doi.org/10.1139/cjz-2018-0167