 Arctic SDI catalogue
geoscientificInformation
Type of resources
Available actions
Keywords
Contact for the resource
Provided by
Years
Formats
Representation types
Update frequencies
status
Service types
Scale
Resolution
-

The compilation represents publicly available reports of geochronological information for Canada. This includes federal, provincial and territorial government publications and reports, university theses, books and journals. Current coverage is limited to those areas that have been the target of recent past compilation efforts, with other areas and updates being included as they become ready. Users should be aware that the compilation may not include all available data for a given area. Every effort is made to report the ages without reinterpreting the original authors' intent. However, care has also been taken to highlight the salient features of the data by which the end-user can make initial judgment on the data robustness. Users are cautioned that because of space limitations and the necessary summarization of often complex datasets, that the original publication should be consulted to verify age interpretations and their rationale. Data may be extracted by the user in tab-delimited text format.
-
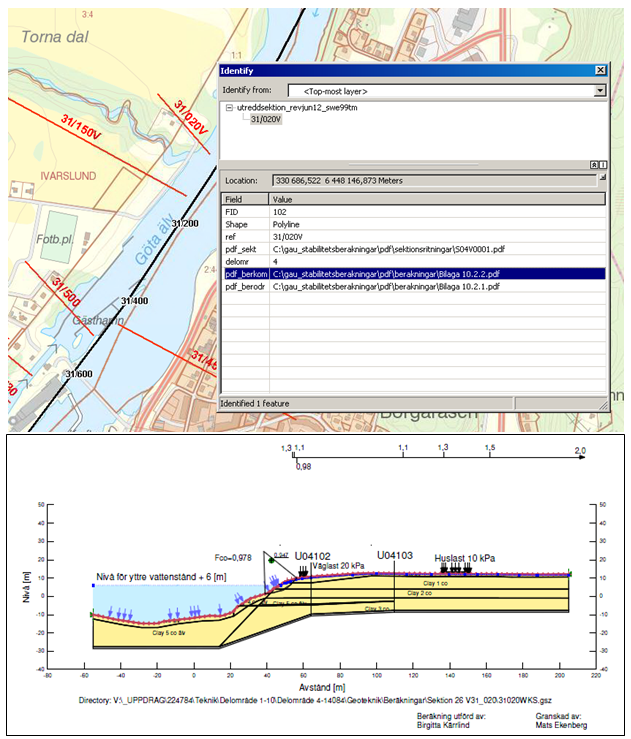
Utredd sektion (reviderad juni 12) med länkar till utförda stabilitetsberäkningar och CAD sektionsritningar. (262 sektioner). Se vidare https://gis.sgi.se/dokument/geodatasezip/stabilitetsberakningspaketet_innehåll.xls och respektive Tekniskt PM och MUR Markundersökningsrapport. [Geoteknik]
-
Borrhål utförda tidigare än 2009 och "utanför" GÄU och som nyttjas till viss del inom GÄU. Över 25.000 sonderingar. Data kommer från Trafikverket Bana Väg i Väst, kommuner m fl. Se https://gis.sgi.se/dokument/geodatasezip/borrhaltidigarepaketet_innehåll.xls och Samtliga rapporter från GÄU: https://www.sgi.se/sv/samhallsplanering--sakerhet/skredriskutredningar/gota-alv/verktyg-underlag-och-rapporter/
-
Projektet Geomorfologisk kartering i fjällen var en översiktlig inventering och värdering av landformer och områden i fjällregionen. Under perioden 1975-1983 producerades 17 stycken rapporter med tillhörande kartor. Rapporterna beskriver området och dess terrängformer. Det finns även naturvärdesbedömningar och utpekande av geomorfologiskt värdefulla områden. Rapporterna innehåller en hel del bilder och illustrationer. Karteringen är i huvudsak baserad på flygbildstolkning (analog hantering) av infraröda flygbilder i skala 1:60 000. Materialen kompletterades med information från tillgänglig litteratur och fältkontroller. Fältkontrollerna koncenterades till svårklassificerade eller intresseväckande objekt men innefattade även stickprovskontroller. De data som är nedladdningsbara via denna länk är de geomorfologiska kartblad som finns som bilaga till varje rapport. Kartorna är scannade och georektifierade till RT90 2,5gV. För optimalt utnyttjande av materialet bör rapporterna studeras. Rapporterna finns endast i analog form. Rapport och författare: Geomorfologiska kartbladet 27G Sulitelma, Ann-Cathrine Ulfstedt Geomorfologiska kartbladet 28 H SAREK, Olle Melander Geomorfologiska kartbladet 30 J Rensjön, Olle Melander Geomorfologiska kartbladet 19 D Åre, Ingmar Borgström Geomorfologiska kartbladet 21 E Håkafot, Ann-Cathrine Ulfstedt Geomorfologiska kartbladet 18 C Sylarna, Ingmar Borgström Geomorfologiska kartbladet 28 G Virihaure, Olle Melander Geomorfologiska kartbladet 18 D Storsjö, Ingmar Borgström Geomorfologiska kartbladet 29 J Kiruna, Olle Melander Geomorfologiska kartbladet 25 G Ammarnäs, Ann-Cathrine Geomorfologiska kartbladet 17C Funäsdalen, Ingmar Borgström, Leif Geomorfologiska kartbladet 27 H Kvikkjokk, Ann-Cathrine Ulfstedt Geomorfologiska kartbladet 19 C Storlien, Ingmar Borgström Geomorfologiska kartbladet 29 I Kebnekaise, Olle Melander Geomorfologiska kartbladet 28 I Stora Sjöfallet, Gunnar Hoppe, Olle Melander Geomorfologiska kartbladet 20 C Skalstugan 20 D Kolåsen 21 D, Ingmar Borgström Geomorfologiska kartbladet 30 H Riksgränsen (öst), 30 I Abisko, 31 H Reurivare och 31 I Vadvetjåkka, Olle Melander
-
Innehåll: Dagens risknivåer, Klimatpåverkan, Utredd sektion (rev juni12, se även Stabilitetsberäkningspaketet), Längdmätning och Bladindelning. Se även https://gis.sgi.se/dokument/geodatasezip/skredriskpaketet_innehåll.xls och "GÄU Slutrapport Del 3 - Kartor", se Samtliga rapporter från GÄU: https://www.sgi.se/sv/samhallsplanering--sakerhet/skredriskutredningar/gota-alv/verktyg-underlag-och-rapporter/ [Geoteknik]
-
The Ontario Detailed Soil Survey dataset series is at a scale of 1: 50 000 and consists of geo-referenced soil polygons with linkages to attribute data found in the associated Component File (CMP), Soil Names File (SNF) and Soil Layer File (SLF). Together, these datasets describe the spatial distribution of soils and associated landscapes for nearly all agricultural areas in southern Ontario.
-
Dynamic Habitat Index. (2000-2005) Satellite derived estimates of photosynthetically active radiation can be obtained from satellites such as MODIS. Knowledge of the land cover allows for calculation the fraction of incoming solar radiation that is absorbed by vegetation. This fraction of photosynthetically active radiation (fPAR) absorbed by vegetation describes rate at which carbon dioxide and energy from sunlight are assimilated into carbohydrates during photosynthesis of plant tissues. The summation of carbon assimilated by the vegetation canopy over time yields the landscape's gross primary productivity. Daily MODIS imagery is the basis for periodic composites and monthly data products. Over the 6 year period from 2000-2005, we calculate the annual average cumulative total of 72 monthly fPAR measurements, to describe the integrated annual vegetative production of the landscape, the integrated average annual minimum monthly fPAR measurement, which describes the annual minimum green cover of the observed landscape, and the integrated average of the annual covariance of fPAR, which describes the seasonality of the observed landscape. We also share the combination of the annual integrated values for visualization and analysis as the Dynamic Habitat Index (with additional information in Coops et al. 2008). When using this data, please cite as: Coops, N.C., Wulder, M.A., Duro, D.C., Han, T. and Berry, S., 2008. The development of a Canadian dynamic habitat index using multi-temporal satellite estimates of canopy light absorbance. Ecological Indicators, 8(5), pp.754-766. ( Coops et al. 2008).
-

The “Soil Landscapes of Canada V.2.2/V.3.1 - Soil Order” displays the highest (most general) level of soil classification. Within the Canadian System of Soil Classification there are ten recognized soil orders (Soil Classification Working Group 1998). This system is hierarchical (from general to specific). Soil orders are further subdivided to great groups, subgroups, families, and series.
-

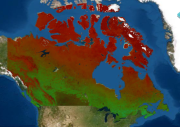
High resolution forest change for Canada (Change Type) 1985-2011 The forest change data included in this product is national in scope (entire forested ecosystem) and represents the first wall-to-wall characterization of wildfire and harvest in Canada at a spatial resolution commensurate with human impacts. The information outcomes represent 27 years of stand replacing change in Canada’s forests, derived from a single, consistent spatially-explicit data source, derived in a fully automated manner. This demonstrated capacity to characterize forests at a resolution that captures human impacts is key to establishing a baseline for detailed monitoring of forested ecosystems from management and science perspectives. Time series of Landsat data were used to characterize national trends in stand replacing forest disturbances caused by wildfire and harvest for the period 1985–2011 for Canada's 650 million hectare forested ecosystems (https://authors.elsevier.com/sd/article/S0034425717301360 ). Landsat data has a 30m spatial resolution, so the change information is highly detailed and is commensurate with that of human impacts. These data represent annual stand replacing forest changes. The stand replacing disturbances types labeled are wildfire and harvest, with lower confidence wildfire and harvest, also shared. The distinction and sharing of lower class membership likelihoods is to indicate to users that some change events were more difficult to allocate to a change type, but are generally found to be in the correct category. For an overview on the data, image processing, and time series change detection methods applied, as well as information on independent accuracy assessment of the data, see Hermosilla et al. (2016; http://www.tandfonline.com/doi/full/10.1080/17538947.2016.1187673). The data available is, 1. a binary change/no-change; 2. Change year; and, 3. Change type. When using this data, please cite as: White, J.C., M.A. Wulder, T. Hermosilla, N.C. Coops, and G. Hobart. (2017). A nationwide annual characterization of 25 years of forest disturbance and recovery for Canada using Landsat time series. Remote Sensing of Environment. 192: 303-321. DOI: 10.1016/j.rse.2017.03.035. https://authors.elsevier.com/sd/article/S0034425717301360 Geographic extent: Canada's forested ecosystems (~ 650 Mha) Time period: 1985–2011
-
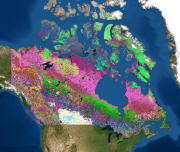
40 Class - Canadian Ecological Domain Classification from Satellite Data. Satellite derived data including 1) topography, 2) landscape productivity based on photosynthetic activity, and 3) land cover were used as inputs to create an environmental regionalization of the over 10 million km2 of Canada’s terrestrial land base. The outcomes of this clustering consists of three main outputs. An initial clustering of 100 classes was generated using a two-stage multivariate classification process. Next, an agglomerative hierarchy using a log-likelihood distance measure was applied to create a 40 and then a 14 class regionalization, aimed to meaningfully group ecologically similar components of Canada's terrestrial landscape. For more information (including a graphical illustration of the cluster hierarchy) and to cite this data please use: Coops, N.C., Wulder, M.A., Iwanicka, D. 2009. An environmental domain classification of Canada using earth observation data for biodiversity assessment. Ecological Informatics, Vol. 4, No. 1, Pp. 8-22, DOI: https://doi.org/10.1016/j.ecoinf.2008.09.005. ( Coops et al. 2009).