 Arctic SDI catalogue
Inland waters
Type of resources
Available actions
Topics
Keywords
Contact for the resource
Provided by
Years
Formats
Representation types
Update frequencies
status
Service types
Scale
-
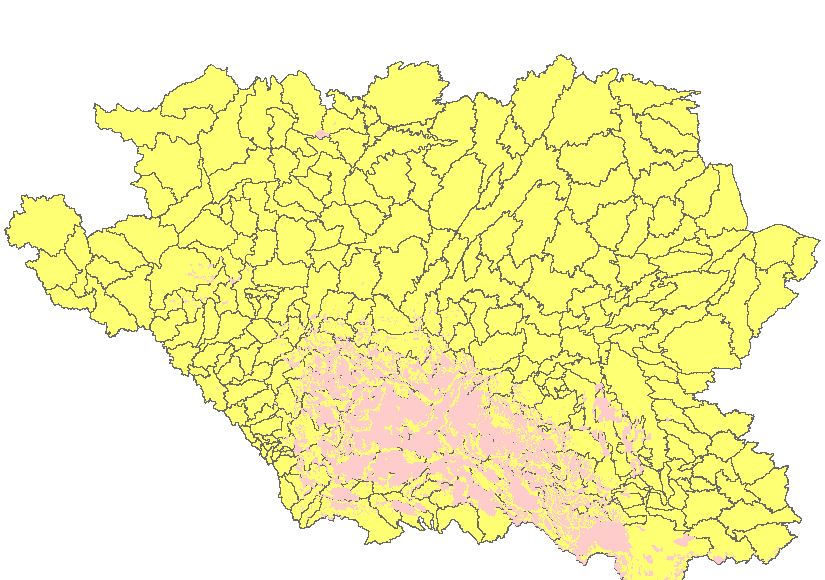
The “Non-contributing Portions of the Incremental Gross Drainage Areas of the AAFC Watersheds Project – 2013” dataset is a geospatial data layer containing polygon features representing the areas within each incremental gross drainage area of the Agriculture and Agri-Food Canada (AAFC) Watersheds Project that DO NOT contribute to average runoff. The Project is subdivided by hydrometric gauging station. The maximum area that could contribute runoff to each gauging station, less that of its upstream neighbour(s) is called an “incremental gross drainage area”. The “incremental gross drainage” areas can be subdivided into portions that either supply surface runoff to an average runoff, or do not. Those portions that are NOT part of the effective drainage area are called ‘non-contributing'.
-

Groundwater samples have been collected in the hydrogeological unit, for various types of analysis. The dataset is not used to represent a particular phenomenon or observation but rather as a utility dataset to add context and reference to groundwater analysis. It represents a general description of the sample site and sample. Sampling methods vary according to the types of analysis.
-
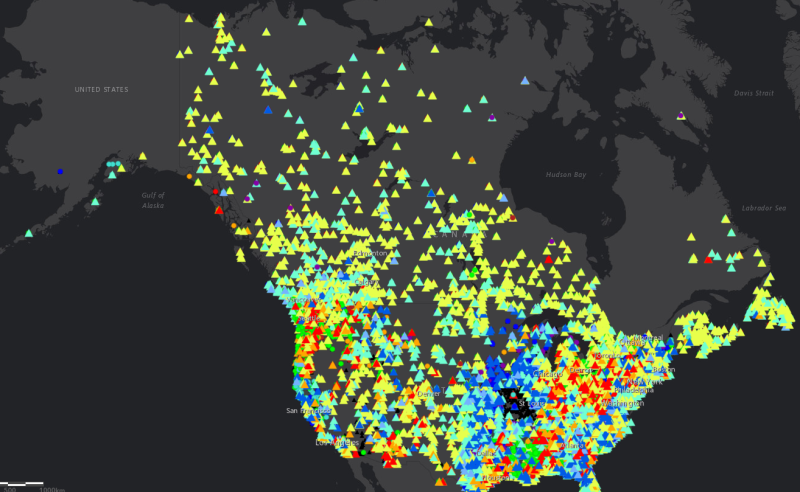
The North America Surface Water Values point dataset contains the current water level and stream flow values as recorded by Canadian and USA hydrometric gauging station locations. Daily values are recorded as well as comparisons with historical measurements, including difference in values from the previous day, the mean level for that calendar date, the annual mean water level, and maximum and minumum recorded levels. Percentile values based on historical average for both water level and stream flow are also included. Real-time gauging station data for Canada is available here: https://wateroffice.ec.gc.ca/search/statistics_e.html Real-time gauging station data for the United States is available here: https://waterservices.usgs.gov/rest/Statistics-Service.html
-

Index outlining historical floodplain mapping areas. Contains links to Floodplain Mapping Reports stored in Ecological Reports Catalogue (EcoCat)
-

Results of circumpolar assessment of river diatoms, indicating (a) the location of river diatom stations, underlain by circumpolar ecoregions; (b) ecoregions with many river diatom stations, colored on the basis of alpha diversity rarefied to 40 stations; (c) all ecoregions with river diatom stations, colored on the basis of alpha diversity rarefied to 10 stations; (d) ecoregions with at least two stations in a hydrobasin, colored on the basis of the dominant component of beta diversity (species turnover, nestedness, approximately equal contribution, or no diversity) when averaged across hydrobasins in each ecoregion. State of the Arctic Freshwater Biodiversity Report - Chapter 4 - Page 36 - Figure 4-8
-
Index containing links to Water Quality Objectives Reports , Summary and Technical, available through Internet
-
Stream Macro-Reaches delineated through interpretation of Topographic features from the 1:50,000 scale Canadian National Topographic Series of Maps.
-
Hydrographic Annotation based on the 1:50,000 scale Canadian National Topographic Series of Maps.
-

Water composition is defined by measuring the amounts of its various constituents; these are often expressed as milligrams of substance per litre of water (mg/L). Sampling methods vary according to the types of analysis. Dataset point: The dataset represents a general description of the sample, including name, ID, type of analysis and lab. It includes numbers describing the results of the analysis and physical properties of groundwater. Time series: The dataset represents a general description of the sample, including name, ID, type of analysis and lab. It includes series of numbers describing the results of the analysis and physical properties of groundwater with associated date. Dynamic values over time at the same sites provides temporal variation data of groundwater composition.
-
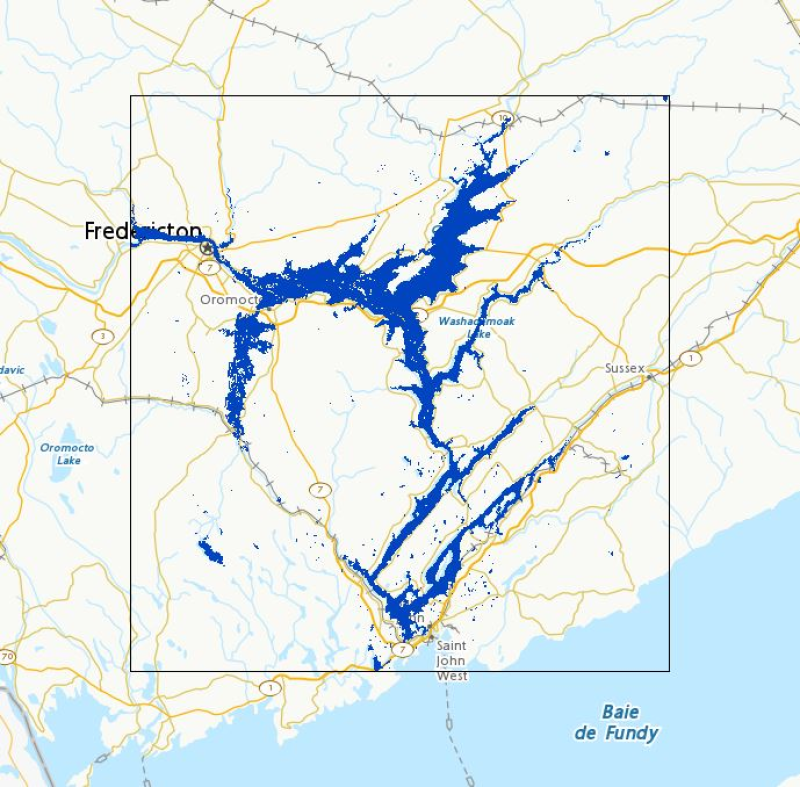
Flood extent polygons from the current calendar year in selected Canadian regions that have been designated for observation, monitored by Natural Resources Canada using satellite imagery for emergency response. Coverage is not comprehensive nationwide. In response to large flood events, Natural Resources Canada (NRCan), for the provision of emergency geomatics services, may be activated by Canada’s emergency management protocols. As new satellite imagery becomes available, NRCan will extract flood extent polygons and update the dataset in near real time (4 hours). This item contains the flood products generated in the past year. For any data relating to previous years, please refer to the [Floods in Canada – Archive]( https://open.canada.ca/data/en/dataset/74144824-206e-4cea-9fb9-72925a128189) entry. Please note that the web mapping service may not display data if flood polygons have not been published by the EGS for the current year. The flood products generated are validated on a best effort basis. Various factors may affect the quality of the flood polygons. These factors include, but are not limited to, sensor type, image resolution, cloud cover or limitations of the flood polygon extraction method. In this layer, where possible, a symbology is applied to the flood polygons based on the underlying land use classification, or is simply unclassified and shows the raw flood extent. When using Web mapping services, to display a specific product, filter by date (UTC Date) and area of interest (AOI). Also, a link to download each product is available in the Resources section. This prepackaged and compressed product contains a Shape file, a PDF file and a KMZ file. Disclaimer : Emergency response authorities are the primary users of these satellite-derived open water flood extent map products. These products are generated to provide analysis and emergency response situational awareness and to facilitate decision-making during major flood events. The open water flood extent products are generated rapidly and limited time is available for editing and validation. The flood products reflect the open water flood conditions at the date/time of acquisition. While efforts are made to produce high quality products, near-real time products may contain errors due to the limited time available for vector editing and validation. Please note that current algorithms do not map flooded areas under the forest canopy and are not optimized for urban flood mapping. Limitation of Liability : Accordingly, the information contained on this website is provided on an “as is” basis and Natural Resources Canada makes no representations or warranties respecting the information, either expressed or implied, arising by law or otherwise, including but not limited to, effectiveness, completeness, accuracy or fitness for a particular purpose. Natural Resources Canada does not assume any liability in respect of any damage or loss based on the use of this website. In no event shall Natural Resources Canada be liable in any way for any direct, indirect, special, incidental, consequential, or other damages based on any use of this website or any other website to which this site is linked, including, without limitation, any lost profits or revenue or business interruption. Parent Collection: - **[Floods in Canada - Cartographic Product Collection](https://open.canada.ca/data/en/dataset/08b810c2-7c81-40f1-adb1-c32c8a2c9f50)**