 Arctic SDI catalogue
oceans
Type of resources
Available actions
Topics
Keywords
Contact for the resource
Provided by
Years
Formats
Representation types
Update frequencies
status
Service types
Scale
Resolution
-

I många sjökort finns specialer, d.v.s. oftast mindre områden som redovisas i bättre skala än huvudkortet. Mestadels över större och mindre hamnar.
-

Korten täcker hela Sveriges skärgård. De används vid navigering inomskärs och i kustnära områden. Skalan är vanligtvis 1:50 000.
-
MSB har tagit fram 9 st utbredningsskikt längs hela Sveriges kust för en vattenståndsnivå från 1 m till 5 m i RH2000. En förenkling har gjorts för att underlätta hanteringen av de stora datamängderna. Det innebär att öar mindre än 5000 kvadratmeter som riskeras att översvämmas har tagits bort och illustreras därför som översvämmade vid respektive havsvattenstånd.
-
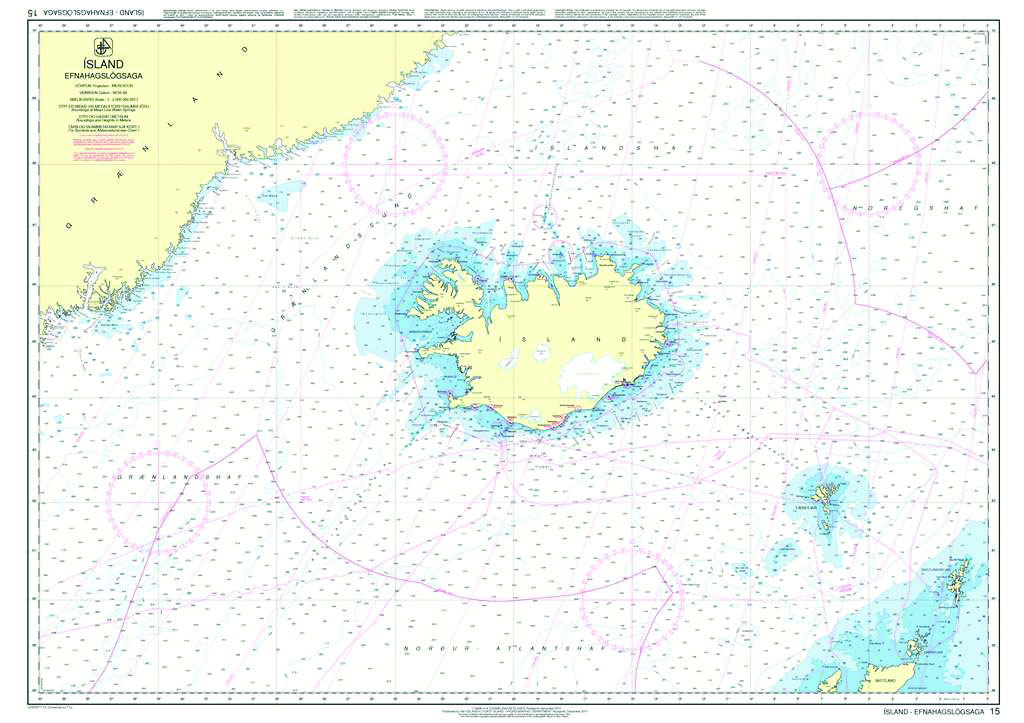
Íslensk sjókort eru gefin út í þremur megin kortaseríum. Hafna- og aðsiglingakort eru 50 talsins, 45 hafnakort og 5 aðsiglingakort. Hafnakort eru í mælikvarða 1:10.000. Aðsiglingakortin eru í mælikvörðum á bilinu 1:35.000 til 1:50.000. Strandsiglingakort í mælikvarða 1:100.000 eru 17 og yfirsiglingakort í mælikvarða 1:300.000 eru 6. Þrjú yfirlitskort eru í mælikvörðum einn á móti milljón og minni. Skrá yfir sjókort er á vef Landhelgisgæslunnar. https://www.lhg.is/media/sjomaelingar_islands/Kortaskra_IS_Catalogue_of_Charts_21.06.2023b.pdf Sjókortin sem hér eru birt hafa ekki verið leiðrétt samkvæmt tilkynningum til sjófarenda. Undantekning frá því eru sjókort í mælikvarða 1:10000 gefin eru út og prentuð eru á blaðstærð A3. Kortin sem þetta á við eru stjörnumerkt [*] í kortaskránni. Sjókortin í vefþjónustunni eru rastamyndir af útgefnum sjókortum eins og staðan er í lok nóvember 2023. Listi yfir sjókort sem eru í gildi og tilkynningar til sjófarenda er að finna á vef Landhelgisgæslunnar: https://www.lhg.is/starfsemi/sjomaelingasvid/tts/uppsafnadar-tilkynningar/ Rammi og bauganet tekið burt: Við gerð rastamyndanna var rammi sjókorts fjarlægður, textaupplýsingar í ramma utan kortflatar og bauganet á kortfleti. Þá voru textaupplýsingar inn á kortfletinum teknar í burtu þar sem að þær voru óþarfar samhengisins vegna. Tákn og skammstafanir á sjókortum eru samræmd á alþjóðavísu (INT1). Tákn og skammstafanir í íslenskum sjókortum eru skýrð í samnefndu riti. Það er aðgengilegt á vef Landhelgisgæslunnar. Dýpi er miðað við meðalstórstraumsfjöru. Dýpi og hæðir eru í metrum. Dýpi að 21 metra er gefið í metrum og desímetrum. Frá 21 til 31 er dýpið á hálfum metra. Frá 32 m er dýpi í heilum metrum.
-
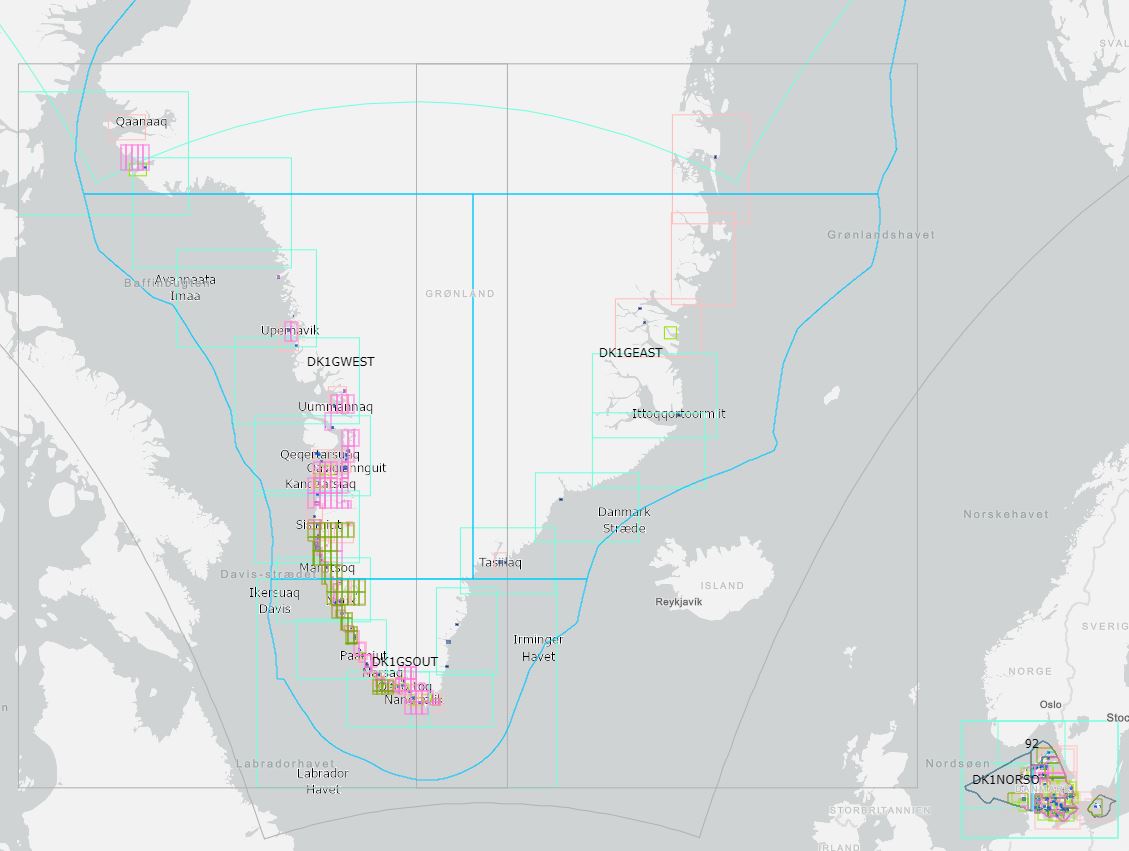
Produktkatalog over danske og grønlandske papirsøkort og elektroniske søkort (ENC) der udgives af Geodatastyrelsen
-
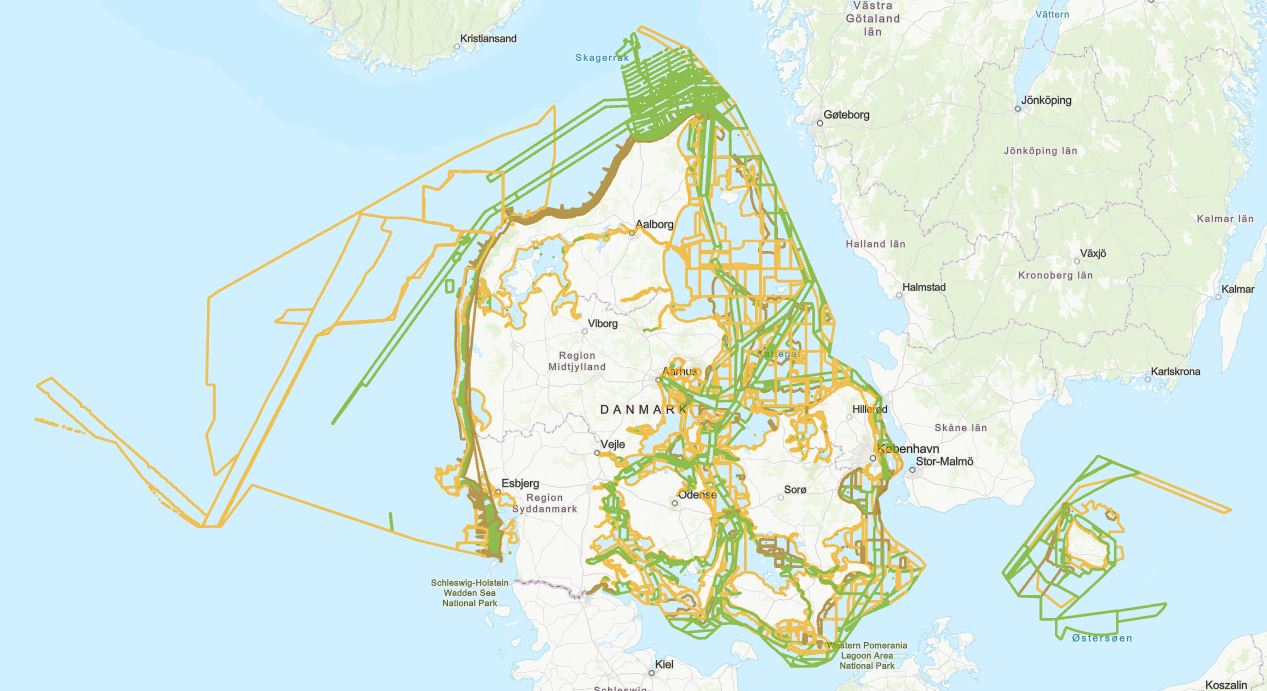
Oversigt over søopmålinger i de danske og grønlandske farvande, der er godkendt til distribution og salg samt søopmålinger, der venter på godkendelse til distribution og salg fra de hydrografiske kontor i Geodatastyrelsen.
-

Bay Scale Assessment of Nearshore Habitat Bras d'Or Lake - Wagmatcook 2007 data is part of the publication Bay Scale Assessment of Nearshore Habitat Bras d'Or Lakes. A history of nearshore benthic surveys of Bras d’Or Lake from 2005 – 2011 is presented. Early work utilized drop camera and fixed mount sidescan. The next phase was one of towfish development, where camera and sidescan were placed on one platform with transponder-based positioning. From 2009 to 2011 the new towfish was used to ground truth an echosounder. The surveys were performed primarily in the northern half of the lake; from 10 m depth right into the shallows at less than 1 m. Different shorelines could be distinguished from others based upon the relative proportions of substrate types and macrophyte canopy. The vast majority of macrophytes occurred within the first 3 m of depth. This zone was dominated by a thin but consistent cover of eelgrass (Zostera marina L.) on almost all shores with a current or wave regime conducive to the growth of this plant. However, the eelgrass beds were frequently in poor shape and the negative impacts of commonly occurring water column turbidity, siltation, or possible localized eutrophication, are suspected. All survey data were placed into a Geographic Information System, and this document is a guide to that package. The Geographic Information System could be used to answer management questions such as the placement and character of habitat compensation projects, the selection of nearshore protected areas or as a baseline to determine long term changes. Vandermeulen, H. 2016. Video-sidescan and echosounder surveys of nearshore Bras d’Or Lake. Can. Tech. Rep. Fish. Aquat. Sci. 3183: viii + 39 p. Cite this data as: Vandermeulen H. Bay Scale Assessment of Nearshore Habitat Bras d'Or Lake - Wagmatcook 2007. Published May 2022. Coastal Ecosystems Science Division, Fisheries and Oceans Canada, Dartmouth, N.S.
-

Bay Scale Assessment of Nearshore Habitat Bras d'Or Lake - Whycocomagh 2007 data is part of the publication Bay Scale Assessment of Nearshore Habitat Bras d'Or Lakes. A history of nearshore benthic surveys of Bras d’Or Lake from 2005 – 2011 is presented. Early work utilized drop camera and fixed mount sidescan. The next phase was one of towfish development, where camera and sidescan were placed on one platform with transponder-based positioning. From 2009 to 2011 the new towfish was used to ground truth an echosounder. The surveys were performed primarily in the northern half of the lake; from 10 m depth right into the shallows at less than 1 m. Different shorelines could be distinguished from others based upon the relative proportions of substrate types and macrophyte canopy. The vast majority of macrophytes occurred within the first 3 m of depth. This zone was dominated by a thin but consistent cover of eelgrass (Zostera marina L.) on almost all shores with a current or wave regime conducive to the growth of this plant. However, the eelgrass beds were frequently in poor shape and the negative impacts of commonly occurring water column turbidity, siltation, or possible localized eutrophication, are suspected. All survey data were placed into a Geographic Information System, and this document is a guide to that package. The Geographic Information System could be used to answer management questions such as the placement and character of habitat compensation projects, the selection of nearshore protected areas or as a baseline to determine long term changes. Vandermeulen, H. 2016. Video-sidescan and echosounder surveys of nearshore Bras d’Or Lake. Can. Tech. Rep. Fish. Aquat. Sci. 3183: viii + 39 p. Cite this data as: Vandermeulen H. Bay Scale Assessment of Nearshore Habitat Bras d'Or Lake - Whycocomagh 2007. Published May 2022. Coastal Ecosystems Science Division, Fisheries and Oceans Canada, Dartmouth, N.S.
-

An annual trawl survey is conducted in Southwestern Nova Scotia and the Bay of Fundy to assess the lobster stocks in the area. The survey is conducted with the Northeast Fisheries Science Center Ecosystem Survey Trawl (NEST), a small mesh trawl with a cod end liner, which ensures the capture of various sizes of lobster. The dimensions and location of the trawl are monitored and recorded throughout the tow using an electronic trawl mensuration system. In addition, water temperature and depth are also monitored. The target tow length is 1 kilometer which is tracked using an Olex marine charting system. Vessel crew, DFO science staff and a contracted at sea observer work together to perform required tasks and collect all relevant data. Catch from each tow is separated by species, weighed and counted. Length frequency data is collected on select groundfish and crab species and detailed morphometric data is collected on each lobster. PARAMETERS COLLECTED: Set information and profile - includes set date, time depth and location Catch summary - weight and number caught of each species Length Freqeuncies - completed for up to 100 fish for selected species Lobster Morphological Data - detailed data collected on each lobster Bottom Temperature Trawl Metrics NOTES ON QUALITY CONTROL: Data is visually verified and double keypunched. On loading to Oracle, data is run through rigorous automated checks to verify data accuracy and integrity. SAMPLING METHODS: The target tow length is 1 kilometer which is tracked using an Olex marine charting system. Vessel crew, DFO science staff and a contracted at sea observer work together to perform required tasks and collect all relevant data. Catch from each tow is separated by species, weighed and counted. Length frequency data is collected on select groundfish and crab species, detailed morphometric data is collected on each lobster. Bottom temperature and trawl metrics are collected for each tow. CITATION LIST: Denton, Cheryl M.. 2020. Maritimes Region Inshore Lobster Trawl Survey Technical Description. Canadian technical reports of fisheries and aquatic sciences (DFO) 3376.
-

Bay Scale Assessment of Nearshore Habitat Bras d'Or Lake - St. Andrews 2011 data is part of the publication Bay Scale Assessment of Nearshore Habitat Bras d'Or Lakes. A history of nearshore benthic surveys of Bras d’Or Lake from 2005 – 2011 is presented. Early work utilized drop camera and fixed mount sidescan. The next phase was one of towfish development, where camera and sidescan were placed on one platform with transponder-based positioning. From 2009 to 2011 the new towfish was used to ground truth an echosounder. The surveys were performed primarily in the northern half of the lake; from 10 m depth right into the shallows at less than 1 m. Different shorelines could be distinguished from others based upon the relative proportions of substrate types and macrophyte canopy. The vast majority of macrophytes occurred within the first 3 m of depth. This zone was dominated by a thin but consistent cover of eelgrass (Zostera marina L.) on almost all shores with a current or wave regime conducive to the growth of this plant. However, the eelgrass beds were frequently in poor shape and the negative impacts of commonly occurring water column turbidity, siltation, or possible localized eutrophication, are suspected. All survey data were placed into a Geographic Information System, and this document is a guide to that package. The Geographic Information System could be used to answer management questions such as the placement and character of habitat compensation projects, the selection of nearshore protected areas or as a baseline to determine long term changes., Vandermeulen, H. 2016. Video-sidescan and echosounder surveys of nearshore Bras d’Or Lake. Can. Tech. Rep. Fish. Aquat. Sci. 3183: viii + 39 p. Cite this data as: Vandermeulen H. Bay Scale Assessment of Nearshore Habitat Bras d'Or Lake - St. Andrews 2011. Published May 2022. Coastal Ecosystems Science Division, Fisheries and Oceans Canada, Dartmouth, N.S.