 Arctic SDI catalogue
Elevation
Type of resources
Categories
Available actions
Topics
Keywords
Contact for the resource
Provided by
Years
Formats
Representation types
Update frequencies
status
Service types
Scale
Resolution
-

-
Høydedata gir en detaljert beskrivelse av terreng og overflate. Dataene er etablert som punktskyer fra flybåren laserskanning eller matching fra flybilder. Punktskyene har varierende tetthet (punkt/m2 ) tilpasset ulike formål. Fra punktskyene er det generert høydemodeller på grid-format av terreng (DTM) og overflate (DOM).
-

LiDAR Services International (LSI), a Calgary-based LiDAR company completed an airborne LiDAR survey for the Redberry Lake Biosphere Reserve (RLBR) and Agriculture and Agri-Foods Canada (AAFC) in October 2011. The project involved collection of LiDAR data for a 362.97 km2 block area, 252.77 km2 for Redberry Lake and 110.20 km2 for AAFC northwest of Saskatoon, SK. Deliverables included: • 1 m bare earth and full feature grids in 1 km x 1 km tiles (ASCII XYZ format) • 1 m bare earth and full feature greyscale hillshades (GeoGeoTIF format) • Classified LiDAR point clouds and ASCII extractor program (LAS v1.2 format)
-

One meter digital elevation model generated from LiDAR point files. LiDAR Services International (LSI), a Calgary-based LiDAR company completed an airborne LiDAR survey for the Redberry Lake Biosphere Reserve (RLBR) and Agriculture and Agri-Foods Canada (AAFC) in October 2011. The project involved collection of LiDAR data for a 362.97 km2 block area, 252.77 km2 for Redberry Lake and 110.20 km2 for AAFC northwest of Saskatoon, SK.
-

One meter digital elevation model generated from bare earth LiDAR points. LiDAR Services International (LSI), a Calgary-based LiDAR company completed an airborne LiDAR survey for the Redberry Lake Biosphere Reserve (RLBR) and Agriculture and Agri-Foods Canada (AAFC) in October 2011. The project involved collection of LiDAR data for a 362.97 km2 block area, 252.77 km2 for Redberry Lake and 110.20 km2 for AAFC northwest of Saskatoon, SK.
-
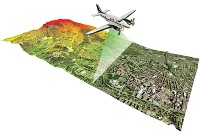
The LiDAR data was produced for an Agriculture and Agri-Food Canada land and water resource study. The data is required to produce high resolution DEMs to improve hydrologic and environmental resource modelling within the area.
-

Digital Elevation Model (DEM) created from LiDAR data captured by McElhanney Consulting Services Ltd (MCSL). The DEM represent s the elevation of the landscape covered by this project.
-

The AAFC Infrastructure Flood Mapping in Saskatchewan 1 meter Full Feature Hillshade is are the full feature hillshades created at a 1 m interval for the capture area of Saskatchewan. The full feature hillshade images were derived from the full feature DEM. The hillshades were created using a 315 degree sun azimuth and 45 degree sun angle.
-
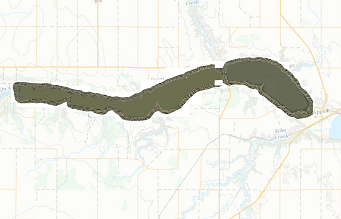
The’ Qu'Appelle Valley Lakes system – Topography and Imagery’ series consists of topographic and imagery data for lakes within the Qu'Appelle River Valley in central Saskatchewan. This data was collected in the fall of 2008 and consists of contour lines, shorelines, spot heights, tile index, and imagery
-
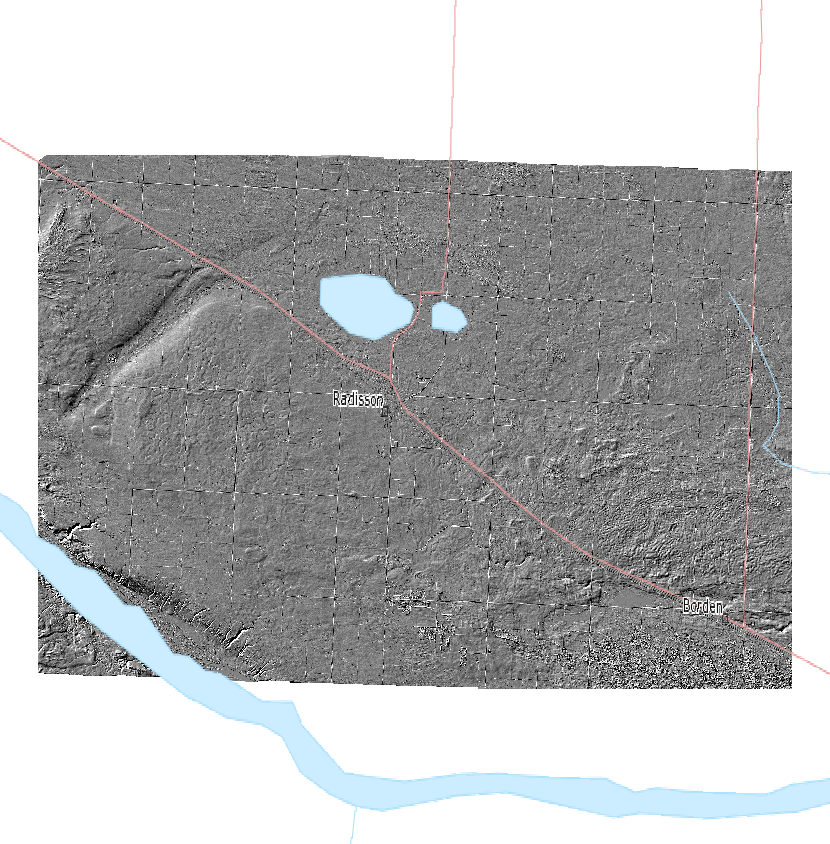
One meter hillshade generated from full feature DEM. LiDAR Services International (LSI), a Calgary-based LiDAR company completed an airborne LiDAR survey for the Redberry Lake Biosphere Reserve (RLBR) and Agriculture and Agri-Foods Canada (AAFC) in October 2011. The project involved collection of LiDAR data for a 362.97 km2 block area, 252.77 km2 for Redberry Lake and 110.20 km2 for AAFC northwest of Saskatoon, SK.