 Arctic SDI catalogue
climatologyMeteorologyAtmosphere
Type of resources
Available actions
Topics
Keywords
Contact for the resource
Provided by
Years
Formats
Representation types
Update frequencies
status
Scale
Resolution
-

Gögnin innhalda staðsetningu veðurstöðva sem eru í eigu Vegagerðarinnar og staðsettar eru við þjóðvegi en einnig veðurstöðvar í eigu Veðurstofunnar og annarra.
-

The Agri-Environmental Indicator of Risk of Water Contamination by Phosphorus dataset estimates the relative risk of phosphorus loss from Soil Landscapes of Canada agricultural areas to surface water. The data series for this indicator consists of four (4) datasets: Annual P-Balance, Soil-P-Source, Edge of Field and IROWC-P. Products in this data series present results for predefined areas as defined by the Soil Landscapes of Canada (SLC v.3.2) data series, uniquely identified by SOIL_LANDSCAPE_ID values.
-

This table contains quality-controlled weather station data from various sources across Canada since 2006.
-

Real-time water level and flow (discharge) data collected at over 2100 hydrometric stations across Canada (last 30 days).
-
Temperature is a key factor affecting the physiological development of field crops as well as crop yield and agricultural product quality achieved during the growing season. Crop responses to the temperature are characterized by three important cardinal temperature indices; the cardinal minimum temperature, maximum cardinal temperature, and optimum temperature for field crop production at which the plant growth and development can start, stop, and proceed at the maximum rate respectively. Agriculture is an important primary production sector in Canada. Agricultural production, profitability, sustainability and food security depend on many agrometeorological factors. Extreme weather events in Canada, such as drought, floods, heat waves, frosts and high intensity storms, have the ability to significantly impact field crop production. Agriculture and Agri-Food Canada (AAFC) and Environment and Climate Change Canada (ECCC) have together developed a suite of extreme agrometeorological indices based on four main categories of weather factors: temperature, precipitation, heat, and wind. The extreme weather indices are intended as short-term prediction tools and generated using ECCC’s medium range forecasts to create a weekly index product on a daily basis.
-

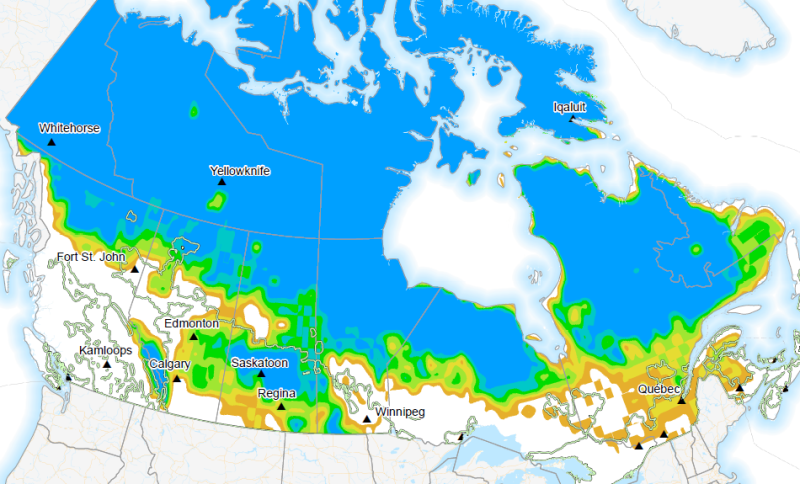
Precipitation Percentiles represents the accumulated precipitation (mm) for the time period compared to historical information for the same time period. This comparison ranks the current precipitation amount and assigns it a percentile value based on a historic record. Products are produced for the following timeframes: Agricultural Year, Growing Season and Winter Season as well as rolling products for 30, 60, 90 and 180 days
-
Probability of maximum wind above 90km/h (mdws90_prob). Week 1 and week 2 forecasted probability is available daily from September 1 to August 31. Week 3 and week 4 forecasted probability is available weekly (Thursday) from September 1 to August 31. Winds can significantly influence crop growth and yield mainly due to mechanical damage of plant vegetative and reproductive organs, an imbalance of plant-soil-atmosphere water relationships, and pest and disease distributions in agricultural fields. The maximum wind speed and the number of strong wind days over the forecast period represent short term and extended strong wind events respectively. Agriculture and Agri-Food Canada (AAFC) and Environment and Climate Change Canada (ECCC) have together developed a suite of extreme agrometeorological indices based on four main categories of weather factors: temperature, precipitation, heat, and wind. The extreme weather indices are intended as short-term prediction tools and generated using ECCC’s medium range forecasts to create a weekly index product on a daily and weekly basis.
-
The Regional Air Quality Deterministic Prediction System FireWork (RAQDPS-FW) carries out physics and chemistry calculations, including emissions from active wildfires, to arrive at deterministic predictions of chemical species concentration of interest to air quality, such as fine particulate matter PM2.5 (2.5 micrometers in diameter or less). Geographical coverage is Canada and the United States. Data is available at a horizontal resolution of 10 km. While the system encompasses more than 80 vertical levels, data is available only for the surface level. The products are presented as historical, annual or monthly, averages which highlight long-term trends in cumulative effects on the environment.
-

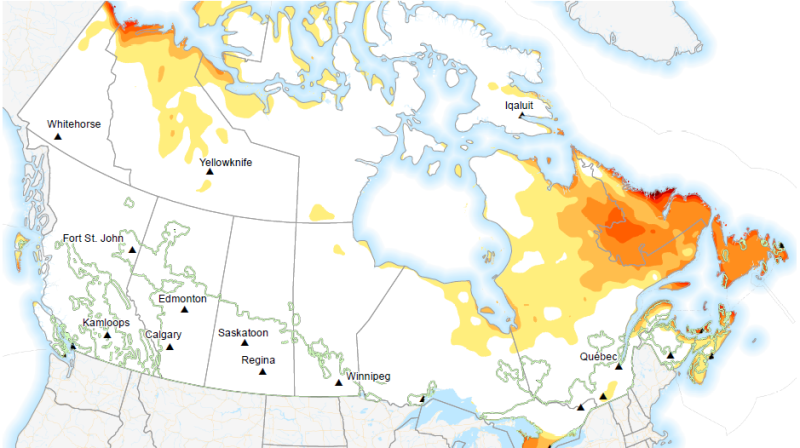
Fire weather refers to weather conditions that are conducive to fire. These conditions determine the fire season, which is the period(s) of the year during which fires are likely to start, spread and do sufficient damage to warrant organized fire suppression. The length of fire season is the difference between the start- and end-of-fire-season dates. These are defined by the Canadian Forest Fire Weather Index (FWI; http://cwfis.cfs.nrcan.gc.ca/) start-up and end dates. Start-up occurs when the station has been snow-free for 3 consecutive days, with noon temperatures of at least 12°C. For stations that do not report significant snow cover during the winter (i.e., less than 10 cm or snow-free for 75% of the days in January and February), start-up occurs when the mean daily temperature has been 6°C or higher for 3 consecutive days. The fire season ends with the onset of winter, generally following 7 consecutive days of snow cover. If there are no snow data, shutdown occurs following 7 consecutive days with noon temperatures lower than or equal to 5°C. Historical climate conditions were derived from the 1981–2010 Canadian Climate Normals. Future projections were computed using two different Representative Concentration Pathways (RCP). RCPs are different greenhouse gas concentration trajectories adopted by the Intergovernmental Panel on Climate Change (IPCC) for its fifth Assessment Report. RCP 2.6 (referred to as rapid emissions reductions) assumes that greenhouse gas concentrations peak between 2010-2020, with emissions declining thereafter. In the RCP 8.5 scenario (referred to as continued emissions increases) greenhouse gas concentrations continue to rise throughout the 21st century. Provided layer: difference in projected fire season length for the medium-term (2041-2070) under the RCP 8.5 (continued emissions increases) compared to reference period across Canada.
-
This file contains output from ensemble. Contains vertical profiles and cross sections.