 Arctic SDI catalogue
Oceans
Type of resources
Available actions
Topics
Keywords
Contact for the resource
Provided by
Years
Formats
Representation types
Update frequencies
status
Service types
Scale
Resolution
-

A history of nearshore benthic surveys of Bras d’Or Lake from 2005 – 2011 is presented. Early work utilized drop camera and fixed mount sidescan. The next phase was one of towfish development, where camera and sidescan were placed on one platform with transponder-based positioning. From 2009 to 2011 the new towfish was used to ground truth an echosounder. The surveys were performed primarily in the northern half of the lake; from 10 m depth right into the shallows at less than 1 m. Different shorelines could be distinguished from others based upon the relative proportions of substrate types and macrophyte canopy. The vast majority of macrophytes occurred within the first 3 m of depth. This zone was dominated by a thin but consistent cover of eelgrass (Zostera marina L.) on almost all shores with a current or wave regime conducive to the growth of this plant. However, the eelgrass beds were frequently in poor shape and the negative impacts of commonly occurring water column turbidity, siltation, or possible localized eutrophication, are suspected. All survey data were placed into a Geographic Information System, and this document is a guide to that package. The Geographic Information System could be used to answer management questions such as the placement and character of habitat compensation projects, the selection of nearshore protected areas or as a baseline to determine long term changes. Vandermeulen, H. 2016. Video-sidescan and echosounder surveys of nearshore Bras d’Or Lake. Can. Tech. Rep. Fish. Aquat. Sci. 3183: viii + 39 p. Cite this data as: Vandermeulen H. Bay Scale Assessment of Nearshore Habitat Bras d'Or Lake. Published May 2022. Coastal Ecosystems Science Division, Fisheries and Oceans Canada, Dartmouth, N.S.
-
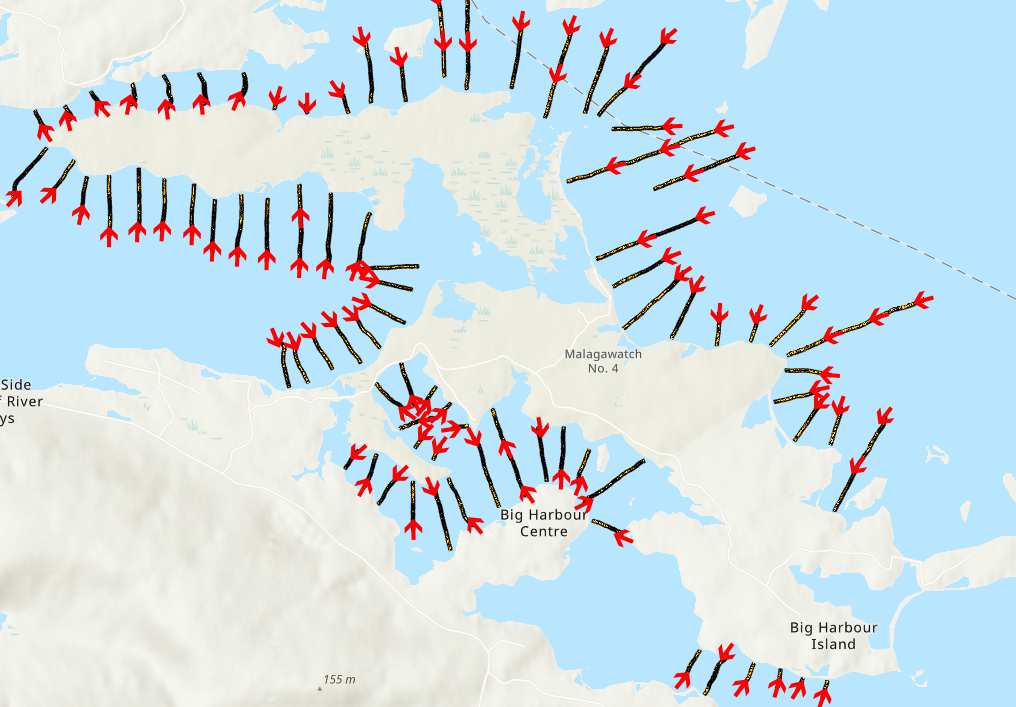
Bay Scale Assessment of Nearshore Habitat Bras dOr Lake - Malagawash 2007 2008 data is part of the publication Bay Scale Assessment of Nearshore Habitat Bras d'Or Lakes. A history of nearshore benthic surveys of Bras d’Or Lake from 2005 – 2011 is presented. Early work utilized drop camera and fixed mount sidescan. The next phase was one of towfish development, where camera and sidescan were placed on one platform with transponder-based positioning. From 2009 to 2011 the new towfish was used to ground truth an echosounder. The surveys were performed primarily in the northern half of the lake; from 10 m depth right into the shallows at less than 1 m. Different shorelines could be distinguished from others based upon the relative proportions of substrate types and macrophyte canopy. The vast majority of macrophytes occurred within the first 3 m of depth. This zone was dominated by a thin but consistent cover of eelgrass (Zostera marina L.) on almost all shores with a current or wave regime conducive to the growth of this plant. However, the eelgrass beds were frequently in poor shape and the negative impacts of commonly occurring water column turbidity, siltation, or possible localized eutrophication, are suspected. All survey data were placed into a Geographic Information System, and this document is a guide to that package. The Geographic Information System could be used to answer management questions such as the placement and character of habitat compensation projects, the selection of nearshore protected areas or as a baseline to determine long term changes. Vandermeulen, H. 2016. Video-sidescan and echosounder surveys of nearshore Bras d’Or Lake. Can. Tech. Rep. Fish. Aquat. Sci. 3183: viii + 39 p. Cite this data as: Vandermeulen H. Bay Scale Assessment of Nearshore Habitat Bras d'Or Lake - Malagawash 2007 - 2008. Published May 2022. Coastal Ecosystems Science Division, Fisheries and Oceans Canada, Dartmouth, N.S.
-

Bay Scale Assessment of Nearshore Habitat - Bras d'Or Lake - Eskasoni 2007 data is part of the publication Bay Scale Assessment of Nearshore Habitat Bras d'Or Lakes. A history of nearshore benthic surveys of Bras d’Or Lake from 2005 – 2011 is presented. Early work utilized drop camera and fixed mount sidescan. The next phase was one of towfish development, where camera and sidescan were placed on one platform with transponder-based positioning. From 2009 to 2011 the new towfish was used to ground truth an echosounder. The surveys were performed primarily in the northern half of the lake; from 10 m depth right into the shallows at less than 1 m. Different shorelines could be distinguished from others based upon the relative proportions of substrate types and macrophyte canopy. The vast majority of macrophytes occurred within the first 3 m of depth. This zone was dominated by a thin but consistent cover of eelgrass (Zostera marina L.) on almost all shores with a current or wave regime conducive to the growth of this plant. However, the eelgrass beds were frequently in poor shape and the negative impacts of commonly occurring water column turbidity, siltation, or possible localized eutrophication, are suspected. All survey data were placed into a Geographic Information System, and this document is a guide to that package. The Geographic Information System could be used to answer management questions such as the placement and character of habitat compensation projects, the selection of nearshore protected areas or as a baseline to determine long term changes. Vandermeulen, H. 2016. Video-sidescan and echosounder surveys of nearshore Bras d’Or Lake. Can. Tech. Rep. Fish. Aquat. Sci. 3183: viii + 39 p. Cite this data as: Vandermeulen H. Bay Scale Assessment of Nearshore Habitat Bras d'Or Lake - Eskasoni 2007. Published May 2022. Coastal Ecosystems Science Division, Fisheries and Oceans Canada, Dartmouth, N.S.
-
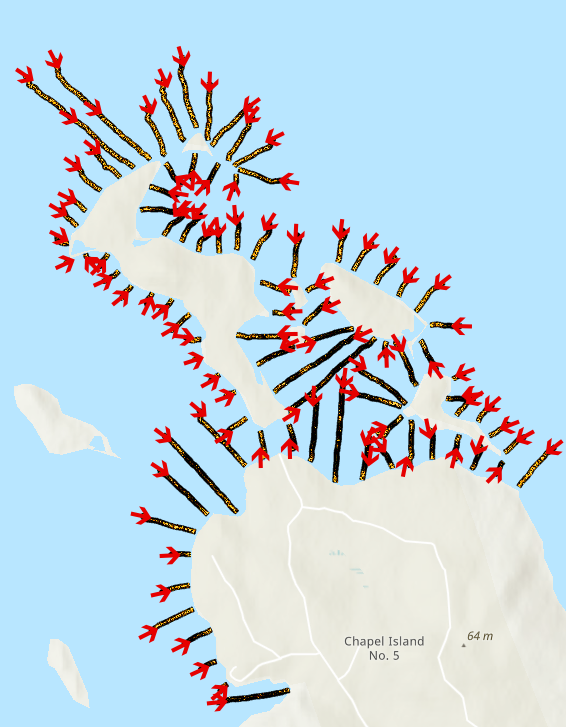
Bay Scale Assessment of Nearshore Habitat Bras d'Or Lake - Chapel Island 2008 data is part of the publication Bay Scale Assessment of Nearshore Habitat Bras d'Or Lakes. A history of nearshore benthic surveys of Bras d’Or Lake from 2005 – 2011 is presented. Early work utilized drop camera and fixed mount sidescan. The next phase was one of towfish development, where camera and sidescan were placed on one platform with transponder-based positioning. From 2009 to 2011 the new towfish was used to ground truth an echosounder. The surveys were performed primarily in the northern half of the lake; from 10 m depth right into the shallows at less than 1 m. Different shorelines could be distinguished from others based upon the relative proportions of substrate types and macrophyte canopy. The vast majority of macrophytes occurred within the first 3 m of depth. This zone was dominated by a thin but consistent cover of eelgrass (Zostera marina L.) on almost all shores with a current or wave regime conducive to the growth of this plant. However, the eelgrass beds were frequently in poor shape and the negative impacts of commonly occurring water column turbidity, siltation, or possible localized eutrophication, are suspected. All survey data were placed into a Geographic Information System, and this document is a guide to that package. The Geographic Information System could be used to answer management questions such as the placement and character of habitat compensation projects, the selection of nearshore protected areas or as a baseline to determine long term changes. Vandermeulen, H. 2016. Video-sidescan and echosounder surveys of nearshore Bras d’Or Lake. Can. Tech. Rep. Fish. Aquat. Sci. 3183: viii + 39 p. Cite this data as: Vandermeulen H. Bay Scale Assessment of Nearshore Habitat Bras d'Or Lake - Chapel Island 2008. Published May 2022. Coastal Ecosystems Science Division, Fisheries and Oceans Canada, Dartmouth, N.S.
-

Bay Scale Assessment of Nearshore Habitat Bras d'Or Lake - St. Andrews 2011 data is part of the publication Bay Scale Assessment of Nearshore Habitat Bras d'Or Lakes. A history of nearshore benthic surveys of Bras d’Or Lake from 2005 – 2011 is presented. Early work utilized drop camera and fixed mount sidescan. The next phase was one of towfish development, where camera and sidescan were placed on one platform with transponder-based positioning. From 2009 to 2011 the new towfish was used to ground truth an echosounder. The surveys were performed primarily in the northern half of the lake; from 10 m depth right into the shallows at less than 1 m. Different shorelines could be distinguished from others based upon the relative proportions of substrate types and macrophyte canopy. The vast majority of macrophytes occurred within the first 3 m of depth. This zone was dominated by a thin but consistent cover of eelgrass (Zostera marina L.) on almost all shores with a current or wave regime conducive to the growth of this plant. However, the eelgrass beds were frequently in poor shape and the negative impacts of commonly occurring water column turbidity, siltation, or possible localized eutrophication, are suspected. All survey data were placed into a Geographic Information System, and this document is a guide to that package. The Geographic Information System could be used to answer management questions such as the placement and character of habitat compensation projects, the selection of nearshore protected areas or as a baseline to determine long term changes., Vandermeulen, H. 2016. Video-sidescan and echosounder surveys of nearshore Bras d’Or Lake. Can. Tech. Rep. Fish. Aquat. Sci. 3183: viii + 39 p. Cite this data as: Vandermeulen H. Bay Scale Assessment of Nearshore Habitat Bras d'Or Lake - St. Andrews 2011. Published May 2022. Coastal Ecosystems Science Division, Fisheries and Oceans Canada, Dartmouth, N.S.
-

Bay Scale Assessment of Nearshore Habitat Bras d'Or Lake - Wagmatcook 2007 data is part of the publication Bay Scale Assessment of Nearshore Habitat Bras d'Or Lakes. A history of nearshore benthic surveys of Bras d’Or Lake from 2005 – 2011 is presented. Early work utilized drop camera and fixed mount sidescan. The next phase was one of towfish development, where camera and sidescan were placed on one platform with transponder-based positioning. From 2009 to 2011 the new towfish was used to ground truth an echosounder. The surveys were performed primarily in the northern half of the lake; from 10 m depth right into the shallows at less than 1 m. Different shorelines could be distinguished from others based upon the relative proportions of substrate types and macrophyte canopy. The vast majority of macrophytes occurred within the first 3 m of depth. This zone was dominated by a thin but consistent cover of eelgrass (Zostera marina L.) on almost all shores with a current or wave regime conducive to the growth of this plant. However, the eelgrass beds were frequently in poor shape and the negative impacts of commonly occurring water column turbidity, siltation, or possible localized eutrophication, are suspected. All survey data were placed into a Geographic Information System, and this document is a guide to that package. The Geographic Information System could be used to answer management questions such as the placement and character of habitat compensation projects, the selection of nearshore protected areas or as a baseline to determine long term changes. Vandermeulen, H. 2016. Video-sidescan and echosounder surveys of nearshore Bras d’Or Lake. Can. Tech. Rep. Fish. Aquat. Sci. 3183: viii + 39 p. Cite this data as: Vandermeulen H. Bay Scale Assessment of Nearshore Habitat Bras d'Or Lake - Wagmatcook 2007. Published May 2022. Coastal Ecosystems Science Division, Fisheries and Oceans Canada, Dartmouth, N.S.
-

An annual trawl survey is conducted in Southwestern Nova Scotia and the Bay of Fundy to assess the lobster stocks in the area. The survey is conducted with the Northeast Fisheries Science Center Ecosystem Survey Trawl (NEST), a small mesh trawl with a cod end liner, which ensures the capture of various sizes of lobster. The dimensions and location of the trawl are monitored and recorded throughout the tow using an electronic trawl mensuration system. In addition, water temperature and depth are also monitored. The target tow length is 1 kilometer which is tracked using an Olex marine charting system. Vessel crew, DFO science staff and a contracted at sea observer work together to perform required tasks and collect all relevant data. Catch from each tow is separated by species, weighed and counted. Length frequency data is collected on select groundfish and crab species and detailed morphometric data is collected on each lobster. PARAMETERS COLLECTED: Set information and profile - includes set date, time depth and location Catch summary - weight and number caught of each species Length Freqeuncies - completed for up to 100 fish for selected species Lobster Morphological Data - detailed data collected on each lobster Bottom Temperature Trawl Metrics NOTES ON QUALITY CONTROL: Data is visually verified and double keypunched. On loading to Oracle, data is run through rigorous automated checks to verify data accuracy and integrity. SAMPLING METHODS: The target tow length is 1 kilometer which is tracked using an Olex marine charting system. Vessel crew, DFO science staff and a contracted at sea observer work together to perform required tasks and collect all relevant data. Catch from each tow is separated by species, weighed and counted. Length frequency data is collected on select groundfish and crab species, detailed morphometric data is collected on each lobster. Bottom temperature and trawl metrics are collected for each tow. CITATION LIST: Denton, Cheryl M.. 2020. Maritimes Region Inshore Lobster Trawl Survey Technical Description. Canadian technical reports of fisheries and aquatic sciences (DFO) 3376.
-

The Coastal Infrastructure Vulnerability Index (CIVI) was jointly developed by DFO Science Branch, Small Craft Harbours (SCH) Program and the Economic Analysis and Statistics Directorate. The CIVI was designed with the intent of developing a climate change adaptation tool that would support management decisions regarding the long-term infrastructure planning for SCH sites. The CIVI provides a numerical indication of the relative vulnerability of small craft harbour sites to the effects of climate change and was designed with three component sub-indices: Environmental Exposure (natural forces), Infrastructure, and Socio-economic. The spatial component for the coastline was derived from the CanVec 1:50,000 hydrographic layer (https://open.canada.ca/data/en/dataset/9d96e8c9-22fe-4ad2-b5e8-94a6991b744b). This layer combines the 1:50,000 CanVec coastline of Canada with the following CIVI environmental exposure variables: - projected sea level rise (for the decades 2030, 2040,...2100) in meters - wave height (metres) and wind speed (metres/second) - change in sea ice coverage in Atlantic Canada from the 1970s to the 2000s Sea level change: Data for relative sea level change (SLC) were derived from the Intergovernmental Panel on Climate Change Fifth Assessment Report (IPCC 2014, AR5). The projected relative sea level change under the high emission scenario (RCP8.5) was calculated for all years between 2006 and 2100. Sea level change for the years 2030, 2040, 2050, 2060, 2070, 2080, 2090, and 2100 were used. Wind Speed and Wave Height Modelled hindcasts of yearly maximum wind speed (1990 - 2012) and wave height (1990- 2014) were used. This dataset was generated from IFREMER wave hindcasts using the WAVEWATCH III model with wind data from NCEP Climate Forecast System Reanalysis (CFSR) (Saha et al. 2010). Two high resolution (10 minute) grids of Atlantic and Pacific maximum modeled wind speeds and maximum significant wave height were used for southern Canadian coastal areas while a coarser (30 minute) worldwide grid was used for the Arctic areas. From these datasets the mean annual maximum wind speed over 23 years and the mean maximum significant wave height over 25 years were calculated. Change in sea ice coverage: Sea ice data from the Canadian Ice Service were acquired for Atlantic and Arctic Canada, representing percent ice coverage for each week over four decades (1970s, 1980s, 1990, 2000s). For each decade a single dataset was calculated to represent the sum of all weeks with ice coverage in excess of 50%, with a maximum possible score of 52 weeks for each decade. To measure change in ice duration, the summary mapsheet from the 2000s was subtracted from the 1970s summary mapsheet. The final dataset represents the change between the 1970s and 2000s in the number of weeks with ice concentrations greater than 50%. A positive number indicates a reduction in weeks of ice coverage, a negative number an increase in ice coverage. The data for individual small craft harbours included here contains predicted sea level change for the decades between 2030 and 2100, wave height, windspeed, change in sea ice coverage, population, and the final environmental exposure sub-index value (ESI). The population for each harbour is derived from the 2016 Census of Canada data for the Census subdivision (CSD) geographic unit. Reference: Relative sea-level projections for Canada based on the IPCC Fifth Assessment Report and the NAD83v70VG national crustal velocity model https://doi.org/10.4095/327878 IPCC, 2014. Climate Change 2014: Impacts, Adaptation, and Vulnerability. Part A: Global and Sectoral Aspects. Contribution of Working Group II to the Fifth Assessment Report of the Intergovernmental Panel on Climate Change [Field, C.B., V.R. Barros, D.J. Dokken, K.J. Mach, M.D. Mastrandrea, T.E. Bilir, M. Chatterjee, K.L. Ebi, Y.O. Estrada, R.C. Genova, B. Girma, E.S. Kissel, A.N. Levy, S. MacCracken, P.R. Mastrandrea, and L.L. White (eds.)]. Cambridge University Press, Cambridge, United Kingdom and New York, NY, USA, 1132 pp. Cite this data as: Greenan B. and Greyson P. Coastal Environmental Exposure Layer. Published March 2022. Ocean Ecosystem Science Division, Fisheries and Oceans Canada, Dartmouth, N.S.
-

Bay Scale Assessment of Nearshore Habitat Bras d'Or Lake - Whycocomagh 2007 data is part of the publication Bay Scale Assessment of Nearshore Habitat Bras d'Or Lakes. A history of nearshore benthic surveys of Bras d’Or Lake from 2005 – 2011 is presented. Early work utilized drop camera and fixed mount sidescan. The next phase was one of towfish development, where camera and sidescan were placed on one platform with transponder-based positioning. From 2009 to 2011 the new towfish was used to ground truth an echosounder. The surveys were performed primarily in the northern half of the lake; from 10 m depth right into the shallows at less than 1 m. Different shorelines could be distinguished from others based upon the relative proportions of substrate types and macrophyte canopy. The vast majority of macrophytes occurred within the first 3 m of depth. This zone was dominated by a thin but consistent cover of eelgrass (Zostera marina L.) on almost all shores with a current or wave regime conducive to the growth of this plant. However, the eelgrass beds were frequently in poor shape and the negative impacts of commonly occurring water column turbidity, siltation, or possible localized eutrophication, are suspected. All survey data were placed into a Geographic Information System, and this document is a guide to that package. The Geographic Information System could be used to answer management questions such as the placement and character of habitat compensation projects, the selection of nearshore protected areas or as a baseline to determine long term changes. Vandermeulen, H. 2016. Video-sidescan and echosounder surveys of nearshore Bras d’Or Lake. Can. Tech. Rep. Fish. Aquat. Sci. 3183: viii + 39 p. Cite this data as: Vandermeulen H. Bay Scale Assessment of Nearshore Habitat Bras d'Or Lake - Whycocomagh 2007. Published May 2022. Coastal Ecosystems Science Division, Fisheries and Oceans Canada, Dartmouth, N.S.
-

Bay Scale Assessment of Habitat in Bras d'Or Lake - River Denys 2005 - 2009 data is part of the publication Bay Scale Assessment of Nearshore Habitat Bras d'Or Lakes. A history of nearshore benthic surveys of Bras d’Or Lake from 2005 – 2011 is presented. Early work utilized drop camera and fixed mount sidescan. The next phase was one of towfish development, where camera and sidescan were placed on one platform with transponder-based positioning. From 2009 to 2011 the new towfish was used to ground truth an echosounder. The surveys were performed primarily in the northern half of the lake; from 10 m depth right into the shallows at less than 1 m. Different shorelines could be distinguished from others based upon the relative proportions of substrate types and macrophyte canopy. The vast majority of macrophytes occurred within the first 3 m of depth. This zone was dominated by a thin but consistent cover of eelgrass (Zostera marina L.) on almost all shores with a current or wave regime conducive to the growth of this plant. However, the eelgrass beds were frequently in poor shape and the negative impacts of commonly occurring water column turbidity, siltation, or possible localized eutrophication, are suspected. All survey data were placed into a Geographic Information System, and this document is a guide to that package. The Geographic Information System could be used to answer management questions such as the placement and character of habitat compensation projects, the selection of nearshore protected areas or as a baseline to determine long term changes. Vandermeulen, H. 2016. Video-sidescan and echosounder surveys of nearshore Bras d’Or Lake. Can. Tech. Rep. Fish. Aquat. Sci. 3183: viii + 39 p. Cite this data as: Vandermeulen H. Bay Scale Assessment of Nearshore Habitat Bras d'Or Lake - River Denys 2005 - 2009. Published May 2022. Coastal Ecosystems Science Division, Fisheries and Oceans Canada, Dartmouth, N.S.