 Arctic SDI catalogue
Geoscientific information
Type of resources
Available actions
Topics
Keywords
Contact for the resource
Provided by
Years
Formats
Representation types
Update frequencies
status
Scale
Resolution
-

The compilation represents publicly available reports of geochronological information for Canada. This includes federal, provincial and territorial government publications and reports, university theses, books and journals. Current coverage is limited to those areas that have been the target of recent past compilation efforts, with other areas and updates being included as they become ready. Users should be aware that the compilation may not include all available data for a given area. Every effort is made to report the ages without reinterpreting the original authors' intent. However, care has also been taken to highlight the salient features of the data by which the end-user can make initial judgment on the data robustness. Users are cautioned that because of space limitations and the necessary summarization of often complex datasets, that the original publication should be consulted to verify age interpretations and their rationale. Data may be extracted by the user in tab-delimited text format.
-

The "Canadian Database of Geochemical Surveys" has two long-term goals. Firstly, it aims to catalogue all of the regional geochemical surveys that have been carried out across Canada, beginning in the 1950s. Secondly, it aims to make the raw data from those surveys available in a standardised format. Over 1,500 surveys have been catalogued. Of these, the raw data for over 300 have been converted to a standardised format. The catalogue can be searched at https:\\geochem.nrcan.gc.ca
-

High-resolution binary wetland map for Canada (2001-2016). Wetland map for the forested ecosystems of Canada focused on current conditions. The binary wetland data included in this product is national in scope (entirety of forested ecosystem) and represents the wall to wall characterization for 2001-2016 (see Wulder et al. 2018). This product was generated using both annual gap free composite reflectance images and annual forest change maps following the Virtual Land Cover Engine (VLCE) process (see Hermosilla et al. 2018), over the 650 million ha forested ecosystems of Canada. Elements of the VLCE classification approach are inclusion of disturbance information in the processes as well as ensuring class transitions over time are logical. Further, a Hidden Markov Model is implemented to assess individual year class likelihoods to reduce variability and possible noise in year-on-year class assignments (for instances when class likelihoods are similar). For this product, to be considered as currently a wetland a pixel must have been classified as wetland at least 80% or 13 of the 16 years between 2001 and 2016, inclusively. For an overview on the data, image processing, and time series change detection methods applied, see Wulder et al. (2018). Wulder, M.A., Z. Li, E. Campbell, J.C. White, G. Hobart, T. Hermosilla, and N.C. Coops (2018). A National Assessment of Wetland Status and Trends for Canada’s Forested Ecosystems Using 33 Years of Earth Observation Satellite Data. Remote Sensing. For a detailed description of the VLCE process and the subsequently generated land cover product, including an accuracy assessment, please see Hermosilla et al. (2018).
-

Forest Basal Area 2015 Cross-sectional area of tree stems at breast height. The sum of the cross-sectional area (i.e. basal area) of each tree in square metres in a plot, divided by the area of the plot (ha) (units = m2ha). Products relating the structure of Canada's forested ecosystems have been generated and made openly accessible. The shared products are based upon peer-reviewed science and relate aspects of forest structure including: (i) metrics calculated directly from the lidar point cloud with heights normalized to heights above the ground surface (e.g., canopy cover, height), and (ii) modelled inventory attributes, derived using an area-based approach generated by using co-located ground plot and ALS data (e.g., volume, biomass). Forest structure estimates were generated by combining information from lidar plots (Wulder et al. 2012) with Landsat pixel-based composites (White et al. 2014; Hermosilla et al. 2016) using a nearest neighbour imputation approach with a Random Forests-based distance metric. These products were generated for strategic-level forest monitoring information needs and are not intended to support operational-level forest management. All products have a spatial resolution of 30 m. For a detailed description of the data, methods applied, and accuracy assessment results see Matasci et al. (2018). When using this data, please cite as follows: Matasci, G., Hermosilla, T., Wulder, M.A., White, J.C., Coops, N.C., Hobart, G.W., Bolton, D.K., Tompalski, P., Bater, C.W., 2018b. Three decades of forest structural dynamics over Canada's forested ecosystems using Landsat time-series and lidar plots. Remote Sensing of Environment 216, 697-714. Matasci et al. 2018) Geographic extent: Canada's forested ecosystems (~ 650 Mha) Time period: 1985–2011
-

High resolution forest change for Canada (Change Type) 1985-2011 The forest change data included in this product is national in scope (entire forested ecosystem) and represents the first wall-to-wall characterization of wildfire and harvest in Canada at a spatial resolution commensurate with human impacts. The information outcomes represent 27 years of stand replacing change in Canada’s forests, derived from a single, consistent spatially-explicit data source, derived in a fully automated manner. This demonstrated capacity to characterize forests at a resolution that captures human impacts is key to establishing a baseline for detailed monitoring of forested ecosystems from management and science perspectives. Time series of Landsat data were used to characterize national trends in stand replacing forest disturbances caused by wildfire and harvest for the period 1985–2011 for Canada's 650 million hectare forested ecosystems (https://authors.elsevier.com/sd/article/S0034425717301360 ). Landsat data has a 30m spatial resolution, so the change information is highly detailed and is commensurate with that of human impacts. These data represent annual stand replacing forest changes. The stand replacing disturbances types labeled are wildfire and harvest, with lower confidence wildfire and harvest, also shared. The distinction and sharing of lower class membership likelihoods is to indicate to users that some change events were more difficult to allocate to a change type, but are generally found to be in the correct category. For an overview on the data, image processing, and time series change detection methods applied, as well as information on independent accuracy assessment of the data, see Hermosilla et al. (2016; http://www.tandfonline.com/doi/full/10.1080/17538947.2016.1187673). The data available is, 1. a binary change/no-change; 2. Change year; and, 3. Change type. When using this data, please cite as: White, J.C., M.A. Wulder, T. Hermosilla, N.C. Coops, and G. Hobart. (2017). A nationwide annual characterization of 25 years of forest disturbance and recovery for Canada using Landsat time series. Remote Sensing of Environment. 192: 303-321. DOI: 10.1016/j.rse.2017.03.035. https://authors.elsevier.com/sd/article/S0034425717301360 Geographic extent: Canada's forested ecosystems (~ 650 Mha) Time period: 1985–2011
-
GE.Bedrock 1:1 000 000 is a transformed version of the SGU product Bedrock1:1 million with the purpose to conform to the Inspire data specification for Geology encoded according to GeoSciML 4.0. It is also a contribution to the OneGeology initiative (www.onegeoloy.org). Data is represented in a two-dimensional model of the top of the bedrock, describing identified geological units geometry, the material composition of the units and geologic events that has acted on the units. Shear displacement structures like faults on the top of bedrock are also included in the model. The main features of the bedrock geology of Sweden is represented in the produkt and since it is based on compilation of bedrock maps of different scales, age and quality the accuracy of the data varies within the dataset. The product is produced for presentation at the scale of 1:1 miilion which means that some units are heavily generalized.
-
The Pan-Canadian Wind Integration Study (PCWIS), completed in 2016, assessed the operational and economic implications of integrating large amounts of wind energy into the Canadian electricity system. The PCWIS study generated a significant amount of high-resolution modelled wind data at many locations across Canada. This dataset contains over 54,000 “cells”, with each cell representing one node on a 2×2 km grid. Each cell has an associated time history of three years of modelled wind data, from 2008 to 2010, at 10-minute intervals. The interactive map allows a user to readily visualize the geographic distribution of Canada’s wind resources, as well as to quickly estimate the strength of the wind resource at a particular location.
-

Forest 95th Percentile Elevation(Ht) 2015 95th percentile of first returns height (m). Products relating the structure of Canada's forested ecosystems have been generated and made openly accessible. The shared products are based upon peer-reviewed science and relate aspects of forest structure including: (i) metrics calculated directly from the lidar point cloud with heights normalized to heights above the ground surface (e.g., canopy cover, height), and (ii) modelled inventory attributes, derived using an area-based approach generated by using co-located ground plot and ALS data (e.g., volume, biomass). Forest structure estimates were generated by combining information from lidar plots (Wulder et al. 2012) with Landsat pixel-based composites (White et al. 2014; Hermosilla et al. 2016) using a nearest neighbour imputation approach with a Random Forests-based distance metric. These products were generated for strategic-level forest monitoring information needs and are not intended to support operational-level forest management. All products have a spatial resolution of 30 m. For a detailed description of the data, methods applied, and accuracy assessment results see Matasci et al. (2018). When using this data, please cite as follows: Matasci, G., Hermosilla, T., Wulder, M.A., White, J.C., Coops, N.C., Hobart, G.W., Bolton, D.K., Tompalski, P., Bater, C.W., 2018b. Three decades of forest structural dynamics over Canada's forested ecosystems using Landsat time-series and lidar plots. Remote Sensing of Environment 216, 697-714. Matasci et al. 2018) Geographic extent: Canada's forested ecosystems (~ 650 Mha) Time period: 1985–2011
-

Dominant Species Map 2015 The data represent dominant tree species for British Columbia forests in 2015, are based upon Landsat data and modeling, with results mapped at 30 m spatial resolution. The map was generated with the Random Forests classifier that used predictor variables derived from Landsat time series including surface reflectance, land cover, forest disturbance, and forest structure, and ancillary variables describing the topography and position. Training and validation samples were derived from the Vegetation Resources Inventory (VRI), from a pool of polygons with homogeneous internal conditions and with low discrepancies with the remotely sensed predictions. Local models were applied over 100x100 km tiles that considered training samples from the 5x5 neighbouring tiles to avoid edge effects. An overall accuracy of 72% was found for the species which occupy 80% of the forested areas. Satellite data and modeling have demonstrated the capacity for up-to-date, wall-to-wall, forest attribute maps at sub-stand level for British Columbia, Canada. BC Species Likelihood 2015 The tree species class membership likelihood distribution data included in this product focused on the province of British Columbia, based upon Landsat data and modeling, with results mapped at 30 m spatial resolution. The data represent tree species class membership likelihood in 2015. The map was generated with the Random Forests classifier that used predictor variables derived from Landsat time series including surface reflectance, land cover, forest disturbance, and forest structure, and ancillary variables describing the topography and position. Training and validation samples were derived from the Vegetation Resources Inventory (VRI) selecting from a stratified pool of polygons with homogeneous internal conditions and with low discrepancies when related to remotely sensed information. Local models were applied over 100x100 km tiles that, to avoid edge effects, considered training samples from the 5x5 neighbouring tiles. An overall accuracy of 72% was found for the species which occupy 80% of the forested areas. As an element of the mapping process, we also obtain the votes received for each class by the Random Forest models. The votes can be understood as analogous to class membership likelihoods, providing enriched information on land cover class uncertainty for use in modeling. Tree species class membership likelihoods lower than 5% have been masked and converted to zero. When using this data, please cite as: Shang, C., Coops, N.C., Wulder, M.A., White, J.C., Hermosilla, T., 2020. Update and spatial extension of strategic forest inventories using time series remote sensing and modeling. International Journal of Applied Earth Observation and Geoinformation 84, 101956. DOI: 10.1016/j.jag.2019.101956 ( Shang et al. 2020).
-
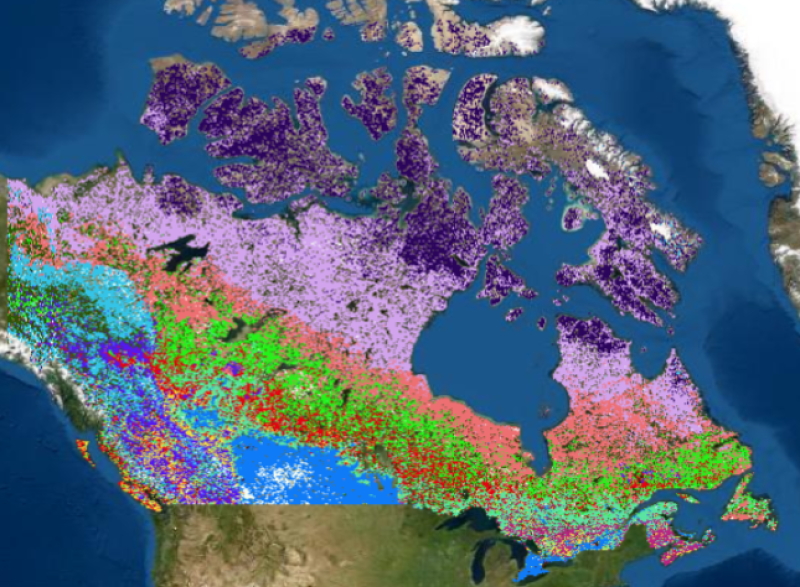
14 Class - Canadian Ecological Domain Classification from Satellite Data. Satellite derived data including 1) topography, 2) landscape productivity based on photosynthetic activity, and 3) land cover were used as inputs to create an environmental regionalization of the over 10 million km2 of Canada’s terrestrial land base. The outcomes of this clustering consists of three main outputs. An initial clustering of 100 classes was generated using a two-stage multivariate classification process. Next, an agglomerative hierarchy using a log-likelihood distance measure was applied to create a 40 and then a 14 class regionalization, aimed to meaningfully group ecologically similar components of Canada's terrestrial landscape. For more information (including a graphical illustration of the cluster hierarchy) and to cite this data please use: Coops, N.C., Wulder, M.A., Iwanicka, D. 2009. An environmental domain classification of Canada using earth observation data for biodiversity assessment. Ecological Informatics, Vol. 4, No. 1, Pp. 8-22, DOI: https://doi.org/10.1016/j.ecoinf.2008.09.005. ( Coops et al. 2009).